What’s happening in the market?
So far this week, Alion 2019 is the top traded wine by value, thanks largely to high volume trades at £478 per 12×75.
Château Mouton Rothschild 2021 follows in second place. This week, it has seen several trades at £3,340, well below its ex-château release price of €350/btl (equivalent at the time of release to £3,584 per 12×75, or £3,486 today).
Today’s deep dive: the Cristal index
- The Cristal index’s bearish trend has moved firmly into the medium-term, but the long-term upward trendline – a level at which the index has historically found support — remains intact.
- The long-term trendline has converged with the upward-trending Lower Bollinger Band and 78.6% Fibonacci retracement level, creating a strong support level.
- The SMA7 is acting as an immediate resistance. If the index recaptures the SMA7, and the SMA7 recaptures the SMA20 in the coming months, technical analysis suggests the likelihood of a bullish trend reversal.
In a recent Market Update, we explored the market’s reaction to the price increases and decreases of three different Champagnes — Salon, Dom Pérignon and Cristal. Today, we take a closer look at Cristal. The Cristal index fell sharply at the turn of the market, losing 28.8% of its value in the year following October 2022. While prices have continued to fall, the bearish trend has lost some momentum in recent months as the index approaches a critical support zone. Technical analysis reveals some evidence suggesting that, at least for Cristal, the floor may be in sight.
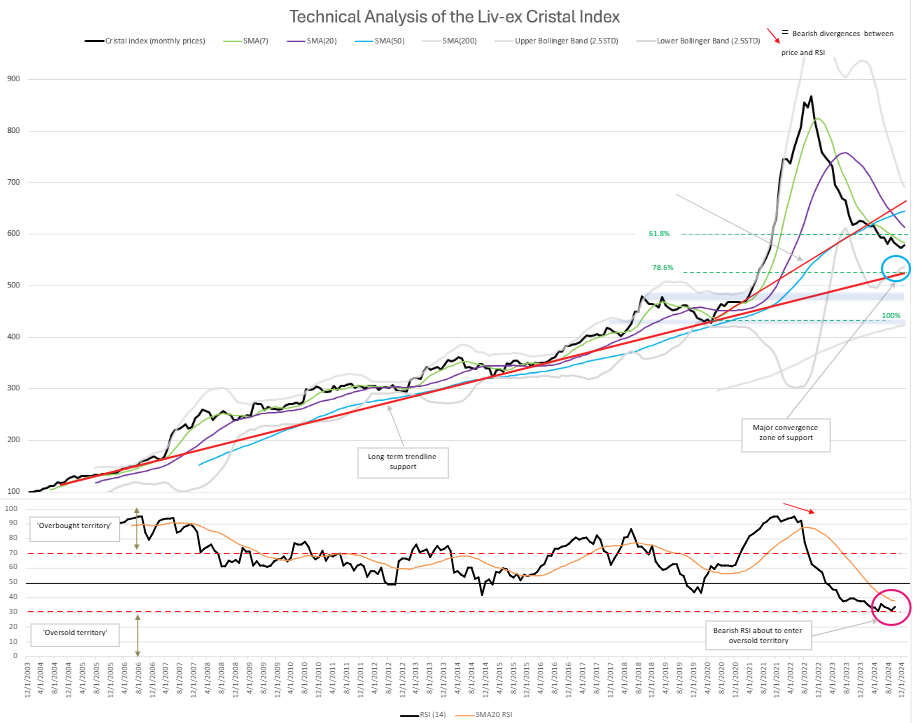
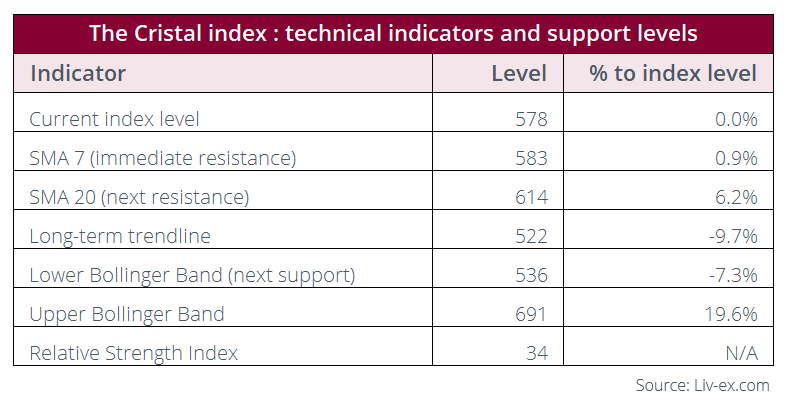
The Cristal Index is currently trading at 578 (as of its January close). Having dipped in December 2024, it moved back up in January, forming the beginnings of a double bottom pattern. The seven-month Simple Moving Average (SMA7) is now serving as an immediate resistance. A break above the SMA7 will provide stronger confirmation of a potential trend reversal.
Still, the SMA20 has crossed below SMA50, moving the short-term bearish trend into the medium term, and forming a ‘death cross’. For firm confirmation of a bullish trend reversal, the index will need to cross not only the SMA7, but also the SMA20, 0.9% and 6.2% above its current level. If the SMA7 can successfully cross above the SMA20 (as appears likely if they continue their current trajectories), this will form a ‘golden cross’, moving the strength of short-term gains into the longer term.
While the index’s bearish trend has moved firmly into the medium-term, the long-term upward trendline remains intact. Promisingly, the index has consistently found support here during previous downturns – in 2014, 2018 and 2020, for example. We can observe long-term trendlines holding as an active support level at a more granular level for older vintages of Cristal, such as the 2002, as shown in the chart below.
Liv-ex trades of Cristal 2002
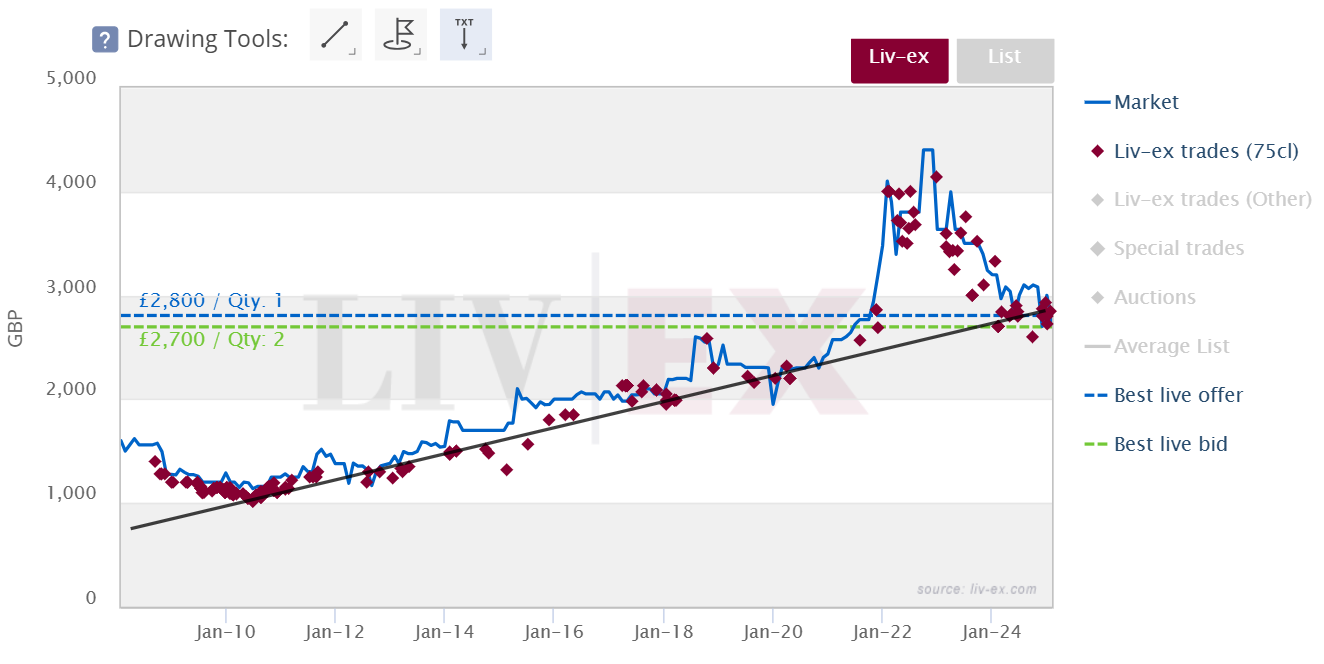
With remarkable consistency, trade volumes of Cristal 2002 have also picked up on this long-term trend line. In each instance, not only have volumes picked up, but prices have also trended upward along the trendline as they did, demonstrating the market’s commitment to this price trend.
Decreasing volatility
The index’s Bollinger Bands are narrowing quickly and have been since May 2024, indicating steadily decreasing volatility. While the narrowing of the bands in 2023 did not result in a trend reversal, it did precede a period of much milder price declines. The Lower Band is acting as the index’s closest dynamic support level — a support that is further strengthened by its recent convergence with the long-term trendline. We can observe a clear example of Cristal’s decreasing price volatility in trades of the 2015 vintage.
Liv-ex trades of Cristal 2015
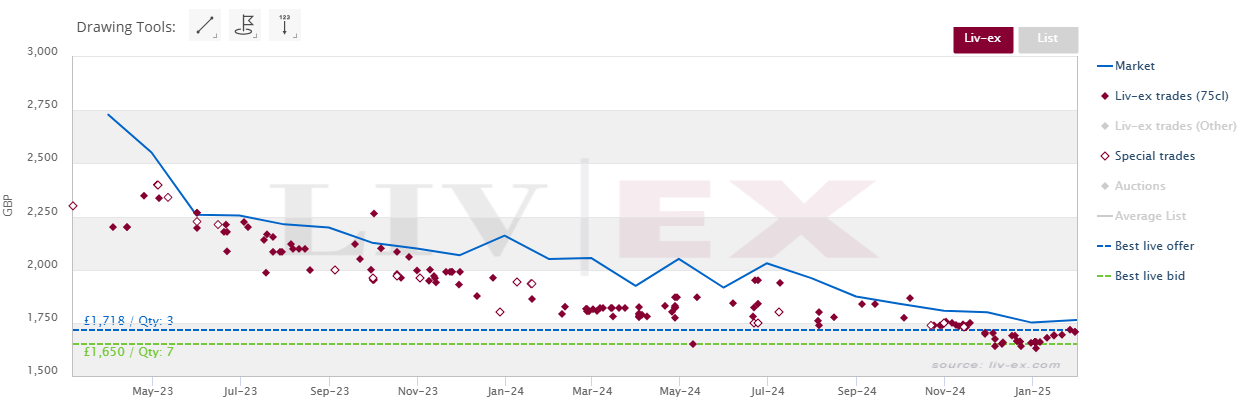
Prices of the 2015 vintage had been trending down since its initial mispriced release into the market at £2,600. December 2024 saw a flurry of trade around the £1,730 per 12×75 mark, followed by a mild drop down to £1,650. Since the start of 2025, prices have been trending upward slightly, with increased volumes and frequency indicating a level of confidence in this slight upward movement.
Looking forward
The Relative Strength Index (RSI) is currently bearish but appears to have rejected oversold territory (below the 30-level). While the index formed a lower low in December, the RSI dropped only to its October level before recovering in January, forming a weak bullish divergence. Having been committed to a strong downward trend, the market is now demonstrating some uncertainty, losing its bearish momentum.
The index sits above a critical convergence zone – the Lower Bollinger Band, long-term trendline and 78.6% Fibonacci retracement level – and is facing resistance immediate resistance from its SMA7. While Cristal is not yet out of the water the next decisive move will offer significant insight into its medium-term trajectory.
Liv-ex analysis is drawn from the world’s most comprehensive database of fine wine prices. The data reflects the real-time activity of Liv-ex’s 620+ merchant members from across the globe. Together they represent the largest pool of liquidity in the world – currently £140m of bids and offers across 20,000 wines.