March Market Report
Share this article | Print this article
- The industry benchmark Liv-ex 100 index rose for the first time in four months. The Liv-ex 1000 index fell for the fourth month in a row.
- Italy was the top performer in February
- Price performance of Jane Anson, Antonio Galloni and Neal Martin’s top-scoring Bordeaux 2020s.
- An overview of Neal Martin’s top-scoring Bordeaux 2019s following the annual Southwold tasting.
- Technical Analysis of the Burgundy 150 index shows that short-term, prices will remain bullish.
- Final Thought – Has Latour’s decision to leave En Primeur paid off?
Introduction
A mixed month for Liv-ex indices
After January’s distractions (Chinese New Year and the Burgundy 2021 campaign), the trade renewed its focus on the secondary market this February, with an 22% increase in trade volume.
The total value of live bids and offers on Liv-ex hit a new record of £118million. The number of wines with an active market also set a new record, with 8,000 labels (LWIN7s) and 20,000 distinct wines including vintages (LWIN11s).
Publication of Bordeaux 2020 in-bottle reports and write ups of the annual Southwold tasting put Bordeaux in the spotlight this month. The region accounted for 38.5% trade by value, up slightly on the previous month (37%). 2019 was the most traded vintage from the region.
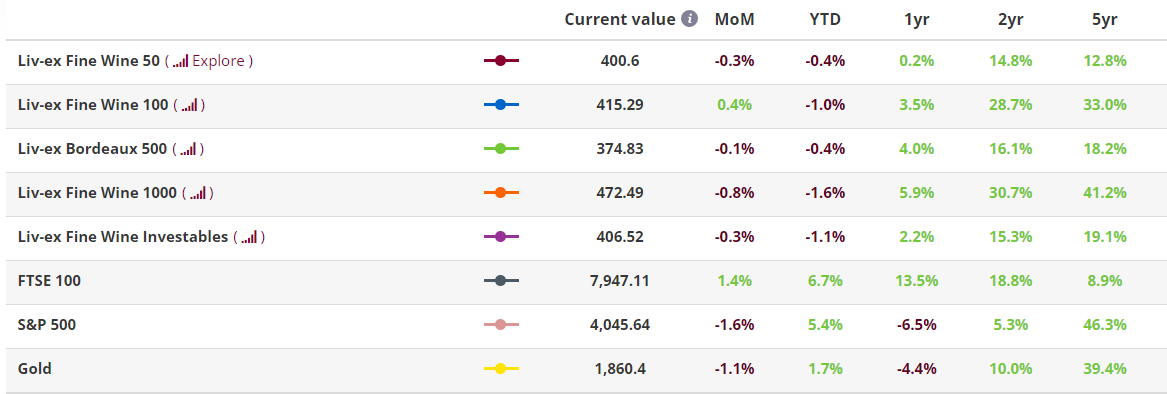
The industry benchmark Liv-ex 100 index rose for the first time in four months. While the broadest measure of the market, the Liv-ex 1000 index, fell for the fourth month in a row.
Of the Liv-ex 1000’s sub-indices, only the Italy 100 managed to rise (+1.1%). Meanwhile, Burgundy replaced Champagne as the worst-performing sub-index, falling 2.1%. This report’s ‘chart of the month’ (which was calculated before the February indices) considers the future direction of the Burgundy 150 using technical analysis.
First Growth’s prices also fell this month, down 0.3%. ‘Off’ vintages accounted for some of the biggest falls in the index, particularly the 2012 and 2017 vintages. The wines that saw the biggest declines were Haut-Brion 2012 (-6.1%), Margaux 2012 (-2.1%), Margaux 2017 (-2.9%), Lafite Rothschild 2017 (-2.2%) and Mouton Rothschild 2017 (-2.0%).
Chart(s) of the month
Technical Analysis of the Burgundy 150
What is technical analysis?
Technical analysis is a method of analysing and predicting stock movements based on past market data, primarily price and volume.
The idea is that past trading activity and prices changes of an ‘asset’ can be valuable indicators of its future price movements.
Our analysis found that while the Burgundy 150 index continues to display an ongoing bullish trend, there are some indicators that, if validated in the months ahead, could point to a change of direction.
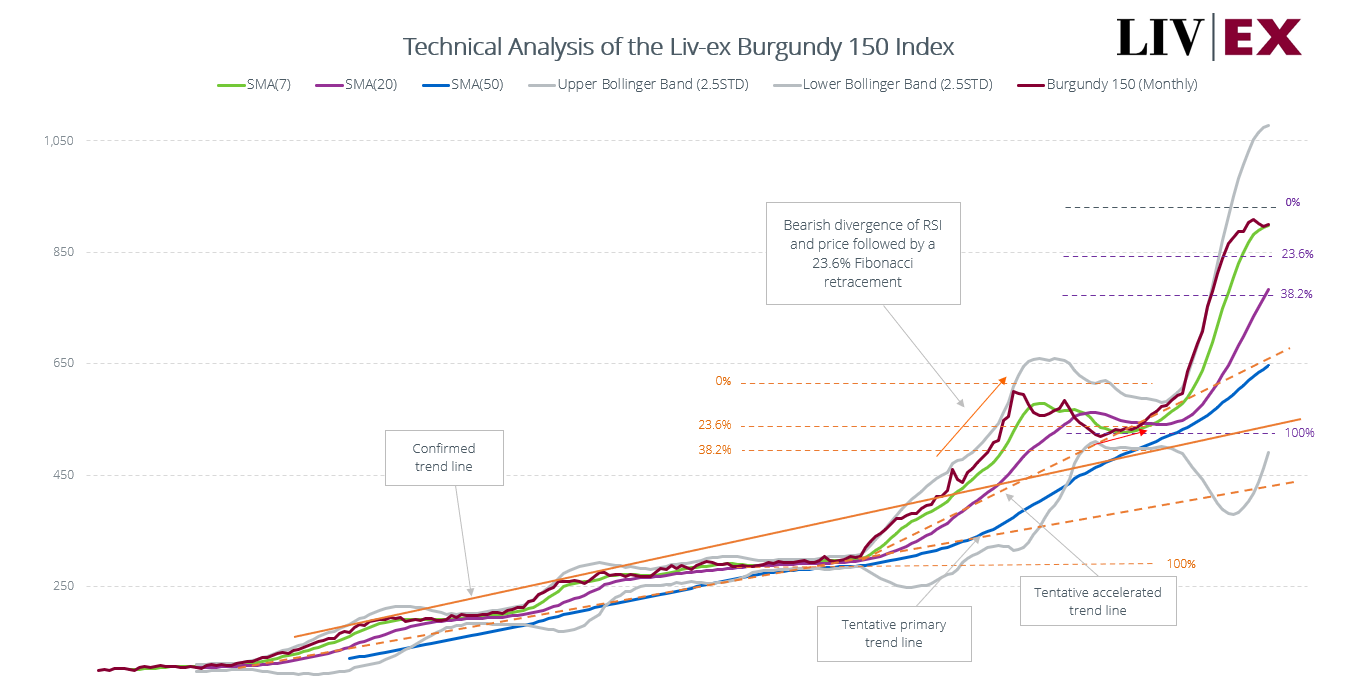
*click the image to enlarge.
Bollinger Bands (BB)
In early 2015, the index’s volatility was subdued (marked by a period of consolidation), which resulted in a Bollinger Bands (BB) squeeze. Typically, this indicates that a breakout is about to happen.
From May 2015, the BBs widened significantly with prices consistently following the upper band and the Simple Moving Average (SMA7) providing support (at a ‘healthy’ 45 degree angle).
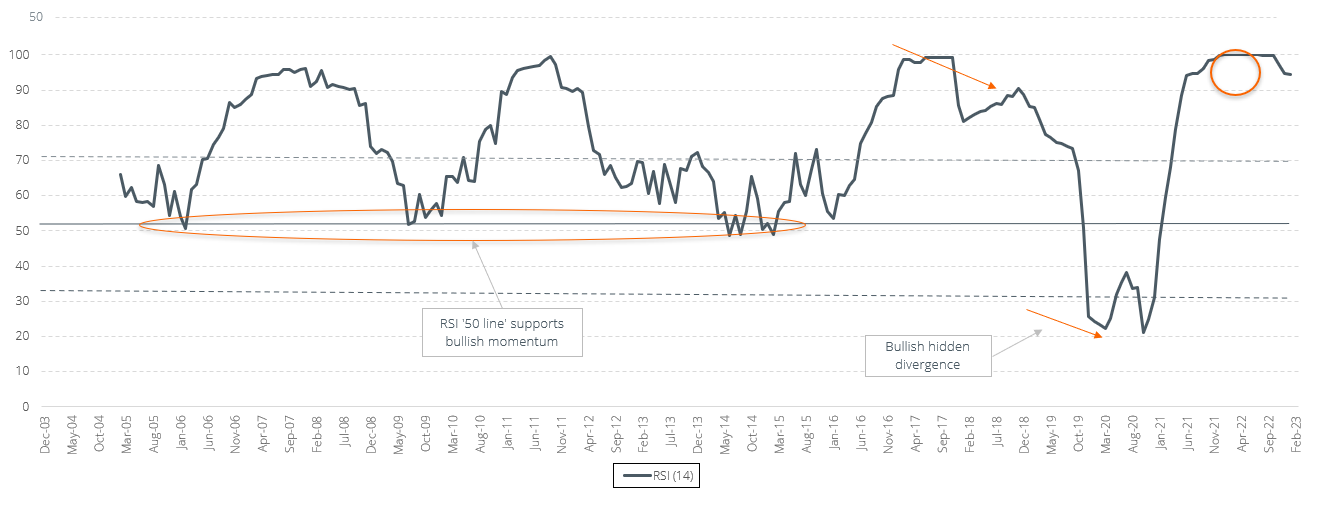
The Relative Strength Index (RSI)
The Relative Strength Index (RSI) is particularly informative about the Burgundy 150 index’s bullish momentum. It has remained above its ’50 line’ an incredible 92% of the time since inception and most of that time in ‘overbought’ territory.
As soon as the RSI fell to the 50 line, it immediately bounced back up. It was only in 2020 that RSI ventured into ‘oversold territory’ when it fell below the 30 line.
Bullish and bearish divergence
The first graph also shows two ‘textbook’ divergences between price and the momentum indicator. From the end of 2017 to early 2019, we have the first bearish divergence, where the index displays higher highs and the RSI shows lower highs. This divergence resulted in a 23.6% Fibonacci Retracement of the rally from the intermediary low in April 2014.
The second divergence is called a ’hidden’ divergence and took place during this correction. A hidden divergence signals continuation in the direction of the prevailing trend (in this case, a bullish trend). The RSI makes lower lows while the index makes a higher low (in the correction phase): it is a bullish hidden divergence.
It was possible to re-enter the bullish trend when the index crossed over the SMA7 in Oct-Nov 2020, and/or when the RSI line crossed its 30 line upwards. From then on, the index rose with exceptional momentum (its RSI was close to 100) and with the price hugging, sometimes even overlapping, the upper BB for an extended period of time. The trio of SMAs has been accompanying the rally, which remains intact at the end of January.
Elliot Wave Theory
The Burgundy 150 index’s movements can be broken down into five phases: three ‘waves’ up and two ‘waves’ down (one consolidation and one correction).
The first phase is a steady increase from inception until November 2013. The second phrase is when the index plateaus from November 2013 until May 2015.
The third phrase is then a strong acceleration until November 2018, followed by a fourth correction phase (which occurs in three waves) to 519 in April 2019. The final phase is its rally to 900+ in October/November 2022.
These waves fit nicely with the Elliott Wave Theory. If the last wave up were to be complete, we would then expect three (multi-year) waves down, correcting at least 38.2% of the entire increase in the index since its inception.
Conclusion
The Burgundy 150 is still supported by its SMA7 and the top BB remains fairly open, suggesting that short-term, it will remain bullish.
Momentum hasn’t yet slowed down and it has been in the ‘overbought’ territory for almost two years now. However, the degree of separation between the price and its SMA20 and SMA50 calls for a pause in the upsurge (at a minimum).
The first two consecutive price declines were in November and December 2022. Interestingly prices were rising in January 2023, but the RSI was not. However, one month of data is not enough to validate a potential bearish divergence.
Signs of the bullish momentum ending?
If the Burgundy 150s bullish momentum were to end (i.e. an invalidation), one should look for the following warning signs:
The first would be that the index’s price would break below the SMA7 (an alert, but not an invalidation). The second (and more serious alert) would be a bearish crossing of the SMA20 by the SMA7 (note that as time goes by, the SMA20 will move up mechanically so a crossover could take place around the 23.6% Fibonacci retracement). While the third, which would invalidate the trend, would be a break below the SMA50, especially if accompanied by a break below the rising trend line.
The above technical analysis was conducted before the February numbers for the Burgundy 150 were calculated.
Major Market Movers
Italy leads the market in February
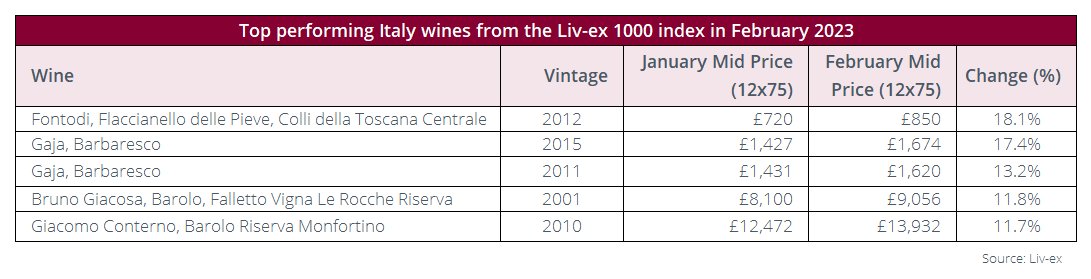
The Italy 100 was the only sub-index of the Liv-ex 1000 to rise this month, up 1.1%. Several wines from Barolo and Barbaresco helped drive the index, as shown by the top-performing wines in the table above.
Fontodi Flaccianello delle Pieve Colli della Toscana Centrale 2012 was the biggest riser, up 18.1%. It was followed by two vintages of Gaja Barbaresco: the 2015 (17.4%) and 2011 (13.2%), along with Bruno Giacosa Barolo Falletto Vigna Le Rocche Riserva 2001 (11.8%).
Giacomo Conterno Barolo Riserva Monfortino 2010 was also up 11.7%. The wine was awarded 100 points by James Suckling, Monica Larner (Wine Advocate) and Antonio Galloni (Vinous). In his tasting note, Galloni commented that it was ‘a vivid, thrilling wine’ and added that ‘the 2010 will soon take its place among the greatest Monfortinos ever made’.
Critical Corner
Top-scoring Bordeaux 2020s
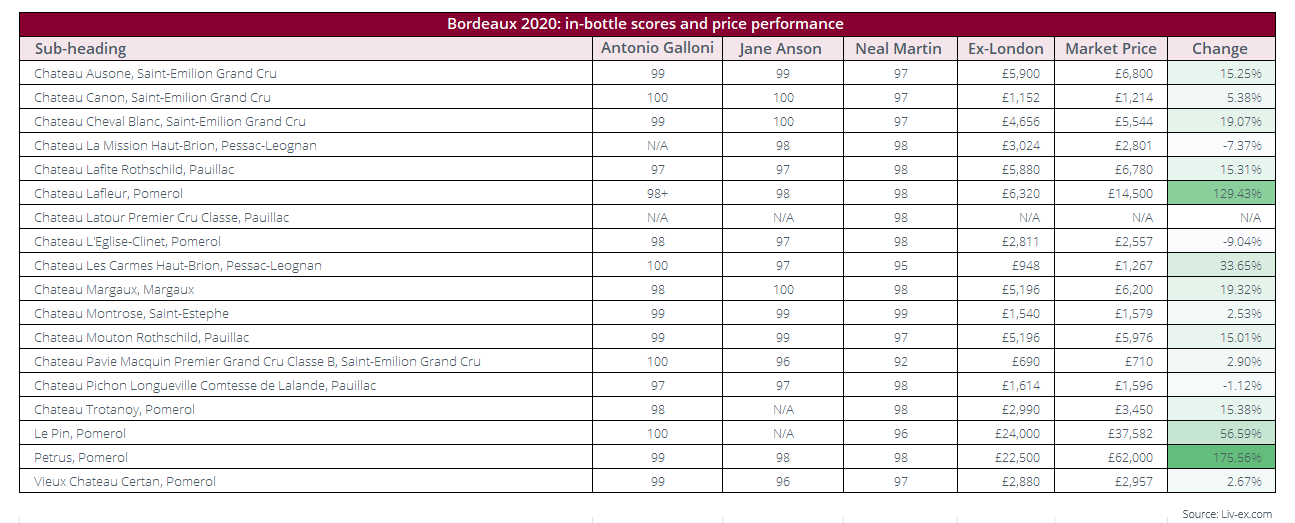
Several critics released their Bordeaux 2020 in-bottle tasting reports last month, including Jane Anson, Antonio Galloni and Neal Martin.
The table above shows the top-scoring wines from each critic, and the price performance of those wines since release En Primeur. As the table shows, several wines received 100-points, but the critics were not completely aligned.
Château Canon 2020 was awarded 100 points by both Antonio Galloni and Jane Anson. Previously, Galloni scored the wine a barrel range of 95-97 points but upgraded it in bottle. In his tasting note, he said it is ‘a wine of mind-blowing purity and nuance’ and ‘has been nothing less than thrilling on the three occasions I have tasted it’.
Galloni also awarded Le Pin, Carmes Haut-Brion and Pavie Macquin 100 points. While Jane Anson gave 100 points to Cheval Blanc and Margaux. In her tasting note, Anson noted that the 2020 Cheval Blanc will continue ‘to be bottled as Premier Grand Cru Classé A until the 2022 vintage, following its withdrawal from the ranking, which will make an interesting footnote for collectors […] but makes zero difference to the brilliance of what is in the bottle’.
By comparison, Neal Martin gave no 100-point scores. His top-scoring wine was Château Montrose, which he awarded 99 points. In his tasting note, he said this ‘this is unequivocally a brilliant wine and a benchmark in recent years’ and added that it was a ‘contender for wine of the vintage’.
For further analysis on Bordeaux’s 2020 vintage, click here.
News Insights
Annual Southwold tasting
Each year, some of the UK’s largest Bordeaux merchants get together for the annual Southwold tasting of Bordeaux 2019 vintage.
According to Neal Martin, the tasting is now almost four decades old and ‘provides a unique opportunity to asses wines against their peers’ via a blind tasting.
The latest edition of Southwold took place between the 16th and 18th of January with ‘around 18 participants, mainly from the trade’.
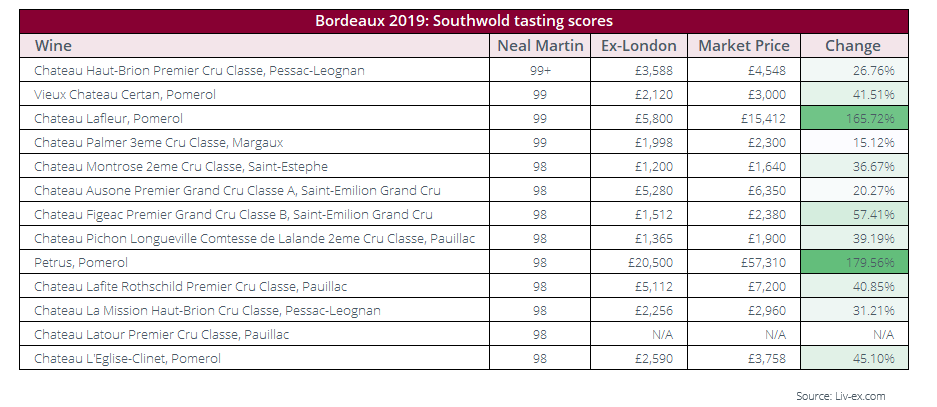
With several merchants and critic publishing their scores and tasting notes from the tasting, we opted to look at Neal Martin’s top scoring wines (published in Vinous) and their price performance since release.
Haut-Brion was Martin’s top-scoring wine, which he awarded a score of 99+ points and said was ‘off the charts’. Three other wines also received 99-points from the critic, including Vieux Chateau Certan, Lafleur and Palmer.
The table below shows Martin’s top-scoring wines (any that received a score of 98 points or more). Of the wines, Lafleur and Petrus have seen the greatest price appreciation since release, of 165.7% and 179.5% respectively. They were followed by Figeac (57.4%), L’Eglise-Clinet (45.1%) and Vieux Chateau Certan (41.5%).
For further analysis on Bordeaux 2019s performance since release, click here.
Final Thought
En primeur, Latour and the secondary market?
Back in 2012, Latour announced that its 2011 wine would be the last vintage offered via the En Primeur system. Since then, the château has been drip-feeding the market with releases from its cellar.
The estate offered its first back-vintage release – Latour 1995 – to the international trade back in 2013. The wine was priced at a premium above cases already in the market and was met with a lukewarm response. Although buyers have historically been willing to pay a premium for provenance, 20% seemed too much of a stretch.
With the Latour 2015 and Forts Latour 2017 due to hit the market later this month, today we take a look at Latour’s secondary market performance in recent years and question if the estate’s decision is finally starting to pay off.
Price performance compared to First Growths
Historically, Latour’s has lagged behind the other First Growths on the secondary market. In 2021, it was the least-traded First Growth. Its 2021 Power 100 ranking was also weighed down by poor price performance.
However, the First Growth has started to outperform some of its peers. On average, Latour prices are up 11.5% over the past five years, compared to 11.2% for Haut-Brion and 7.9% for Margaux.
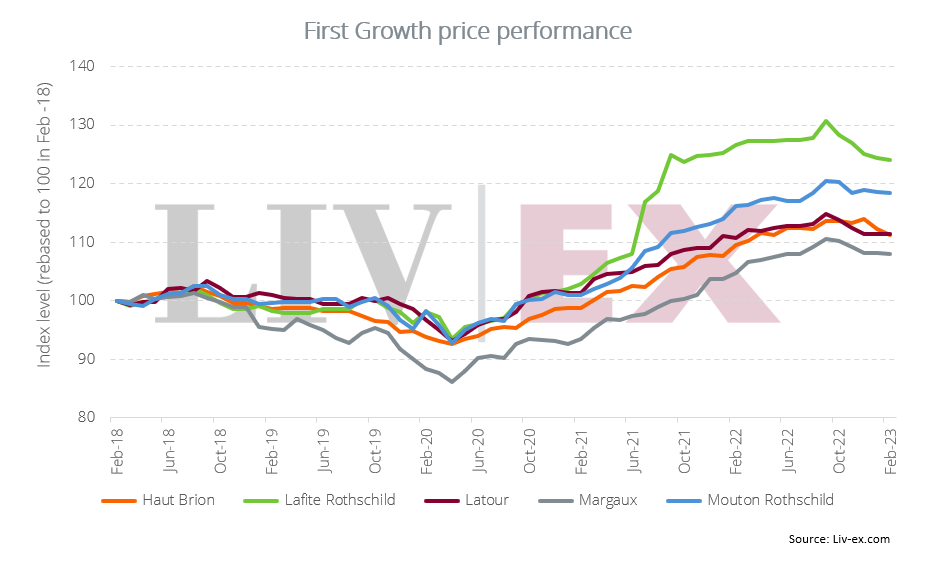
In the 2022 Power 100, Latour ranked 24th – above Margaux and Haut Brion, which placed 33rd and 34th respectively. Part of the reason for its success in the ranking was due to its average Market Price changes. At the time of the Power 100 report, Latour prices were up 9.5% and Lafite Rothschild was the only other First Growth see higher returns (of 14.5%).
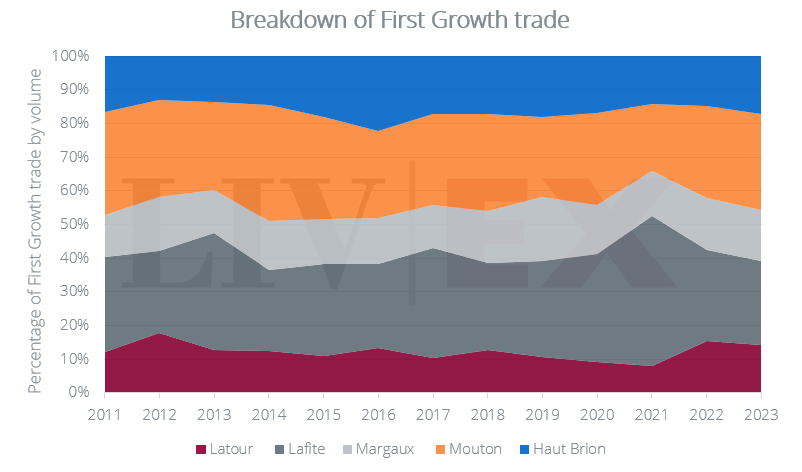
Latour is also beginning to see increased trade on the secondary market. In 2022, it accounted for 15.4% of First Growth trade by volume, up from 7.8% in 2021. (Although this is still below the levels achieved in 2012).
Price performance since release
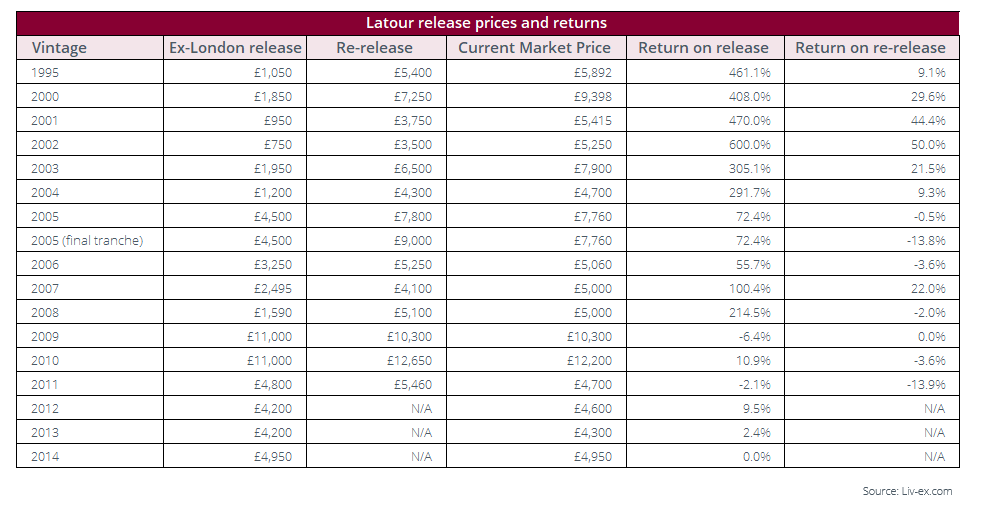
However, despite recent price increases, not all Latour purchases have seen positive returns. The table below shows the returns on Latour vintages both before and after the Château left the En Primeur system.
Buyers who bought the 2007 and 2008 vintages during En Primeur have seen positive nominal returns of 100.4% and 214.5% respectively.
Even those who bought the 2007 vintage when it was re-eleased in 2016 have seen a 22% price increase since.
However, buyers who bought 2008 ex-Chateau in 2019 have seen a 2% drop.
In the coming weeks we will be publishing pricing analysis using our ‘Fair Value’ methodology on the upcoming 2015 release.
Liv-ex analysis is drawn from the world’s most comprehensive database of fine wine prices. The data reflects the real time activity of Liv-ex’s 620 merchant members from across the globe. Together they represent the largest pool of liquidity in the world – currently £100m of bids and offers across 16,000 wines.