What’s happening in the market?
Joseph Drouhin’s Marquis de Laguiche 2022 is the top-traded wine of the week so far by value, changing hands in relatively high volumes around the £6,150 per 12×75 mark, 12.1% below its ex-London release price (£7,000 per 12×75).
Château Lafite Rothschild 2020 is in second place. It traded in high volumes at £4,240 per 12×75 / € 425/btl, 10% below its ex-negociant release price, but still 9% above its ex-château release price
Today’s deep dive: The Ornellaia index
- The market for Ornellaia is firmly bearish, with prices falling in a descending channel.
- The index is testing the upper bound of this channel. If the index can break out and recapture the SMA7 (1.0%) and SMA20 (2.8%) above it, this would indicate a potential reversal in bearish momentum – an end to the bearish trend.
- Should the index fail to recapture its immediate resistance levels, the long-term trendline at 350 (9.6% below the current level) will be a crucial support zone.
- More mature vintages of Ornellaia look to already be trading on these long-term trendlines.
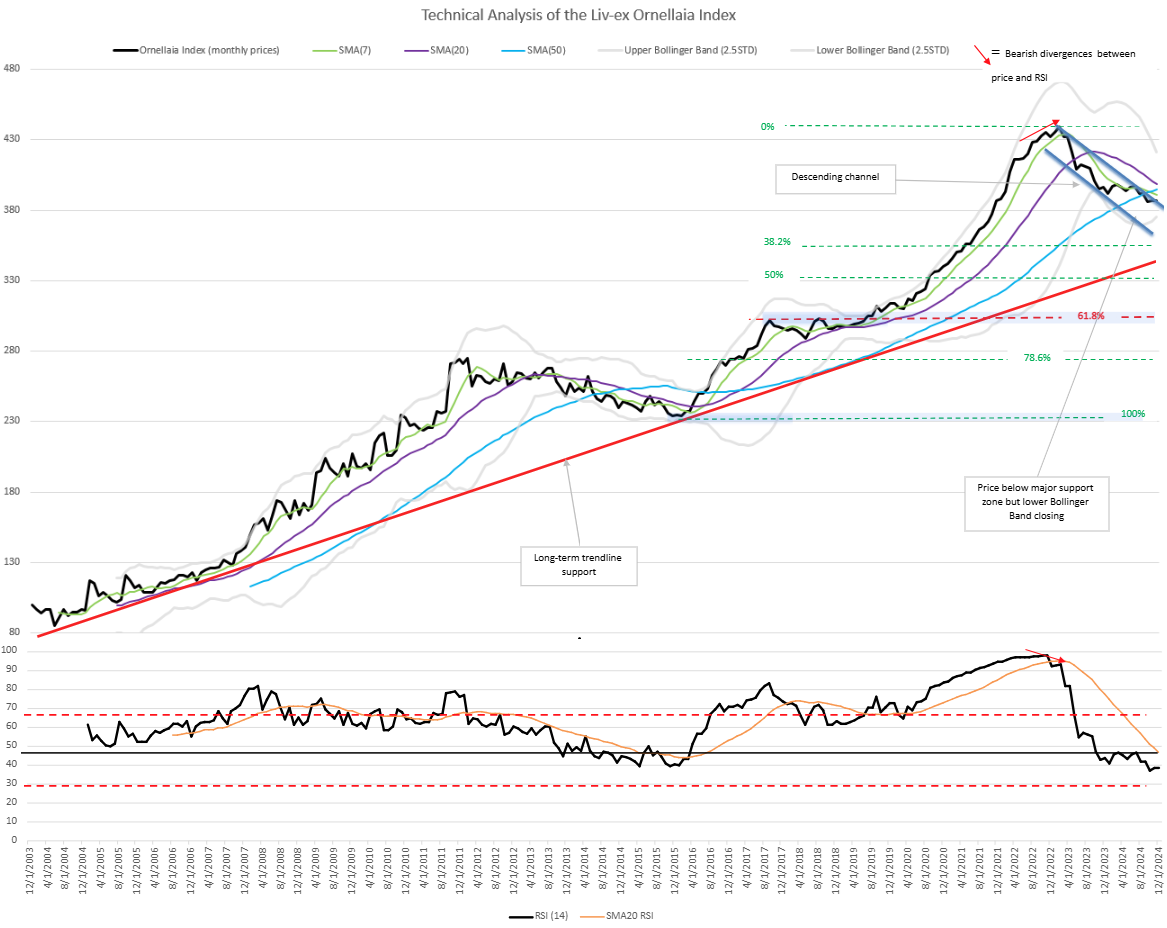
The Liv-ex Ornellaia Index has been trading at 387 for the past two months, a 12% correction from its all-time high in March 2023. The market is firmly bearish, with prices hovering within a descending channel. This channel now frames price action, acting as a dynamic roadmap: resistance at the upper boundary and support at the lower. Until the index breaks out of this channel, further downside or consolidation is likely. While the index’s hold at 387 sets it even with the upper trendline (immediate resistance), this cannot yet be considered a decisive break.
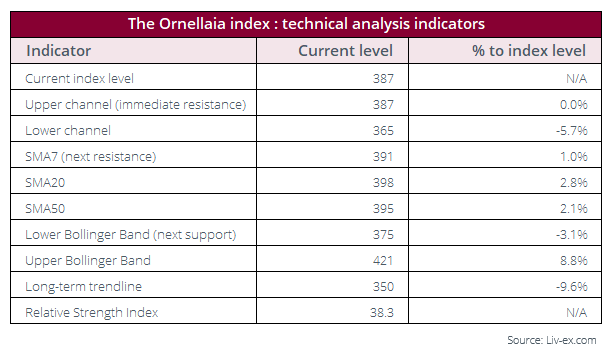
Prices have fallen below all key Simple Moving Averages (SMAs). The SMA7, SMA20, and SMA50 all demonstrate a bearish alignment, with the shorter-term averages positioned below the longer-term averages, reinforcing the downtrend.
The Bollinger Bands are narrowing with trades occurring near the lower band, which currently sits at 375.4. While we may see reduced volatility in the short term as the bands act as dynamic supports, if they continue to contract, the possibility of a price squeeze opens up in the longer term. This would not be dissimilar to the price squeeze in 2013, which resulted in further downward movement.
The Relative Strength Index (RSI), currently in the mid-30s, signals bearish momentum without entering oversold territory. The previous crossing of the 50-line in 2015 appeared to trigger a buy signal. This time, however, no bullish divergence has been demonstrated – the RSI continues to make lower lows.
Possible outcomes
The index is currently testing its immediate resistance at 387 (the upper band of the channel). Beyond this, the SMA7 at 391 and SMA20 at 398 serve as critical resistance levels. If the index can reclaim these levels and the SMA7 can reclaim the SMA20 to form a golden cross (as seen in 2015), this would indicate a potential reversal in bearish momentum. Traded volumes of Ornellaia hit a two-year peak in December as the index reached 386. While lower in January, volumes have picked up in February – buyers are finding value at current price levels.
Should the index fail to recapture its immediate resistance levels, the long-term trendline at 350 (9.6% below the current level) is crucial; a breach here could lead to a sharp drop toward 312, corresponding to the 61.8% Fibonacci retracement.
What does this mean in real terms?
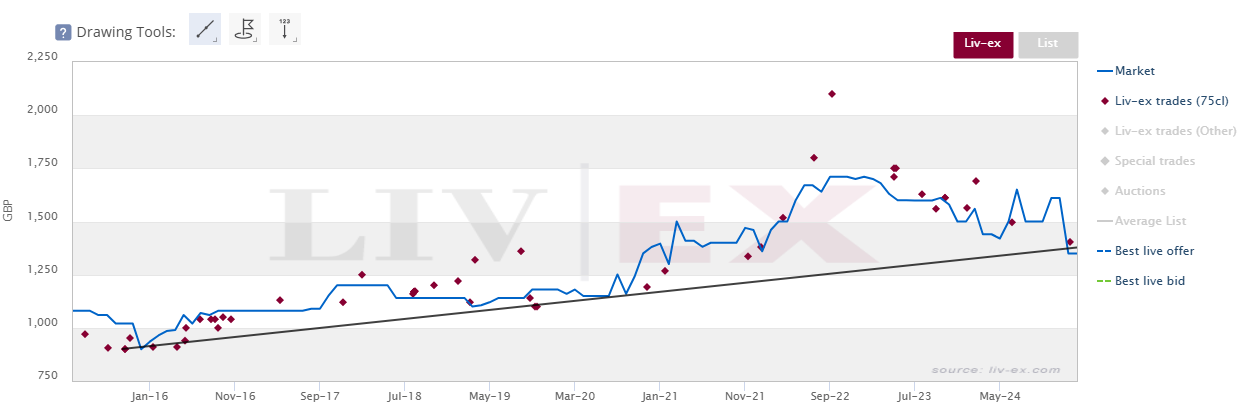
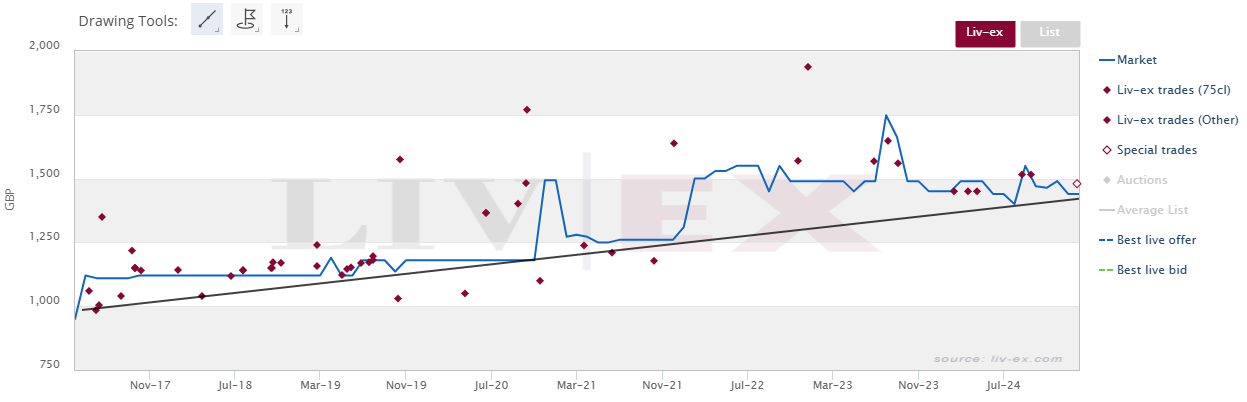
For older vintages of Ornellaia, we are already seeing Market Prices fall to their long-term trendlines, no longer holding at the £1,500 per 12×75 level. The 2012 and 2014 vintages serve as good examples of this. More frequent or higher volume trades would serve as confirmation of this support level holding.
Liv-ex trades of Ornellaia 2012
Liv-ex trades of Ornellaia 2014
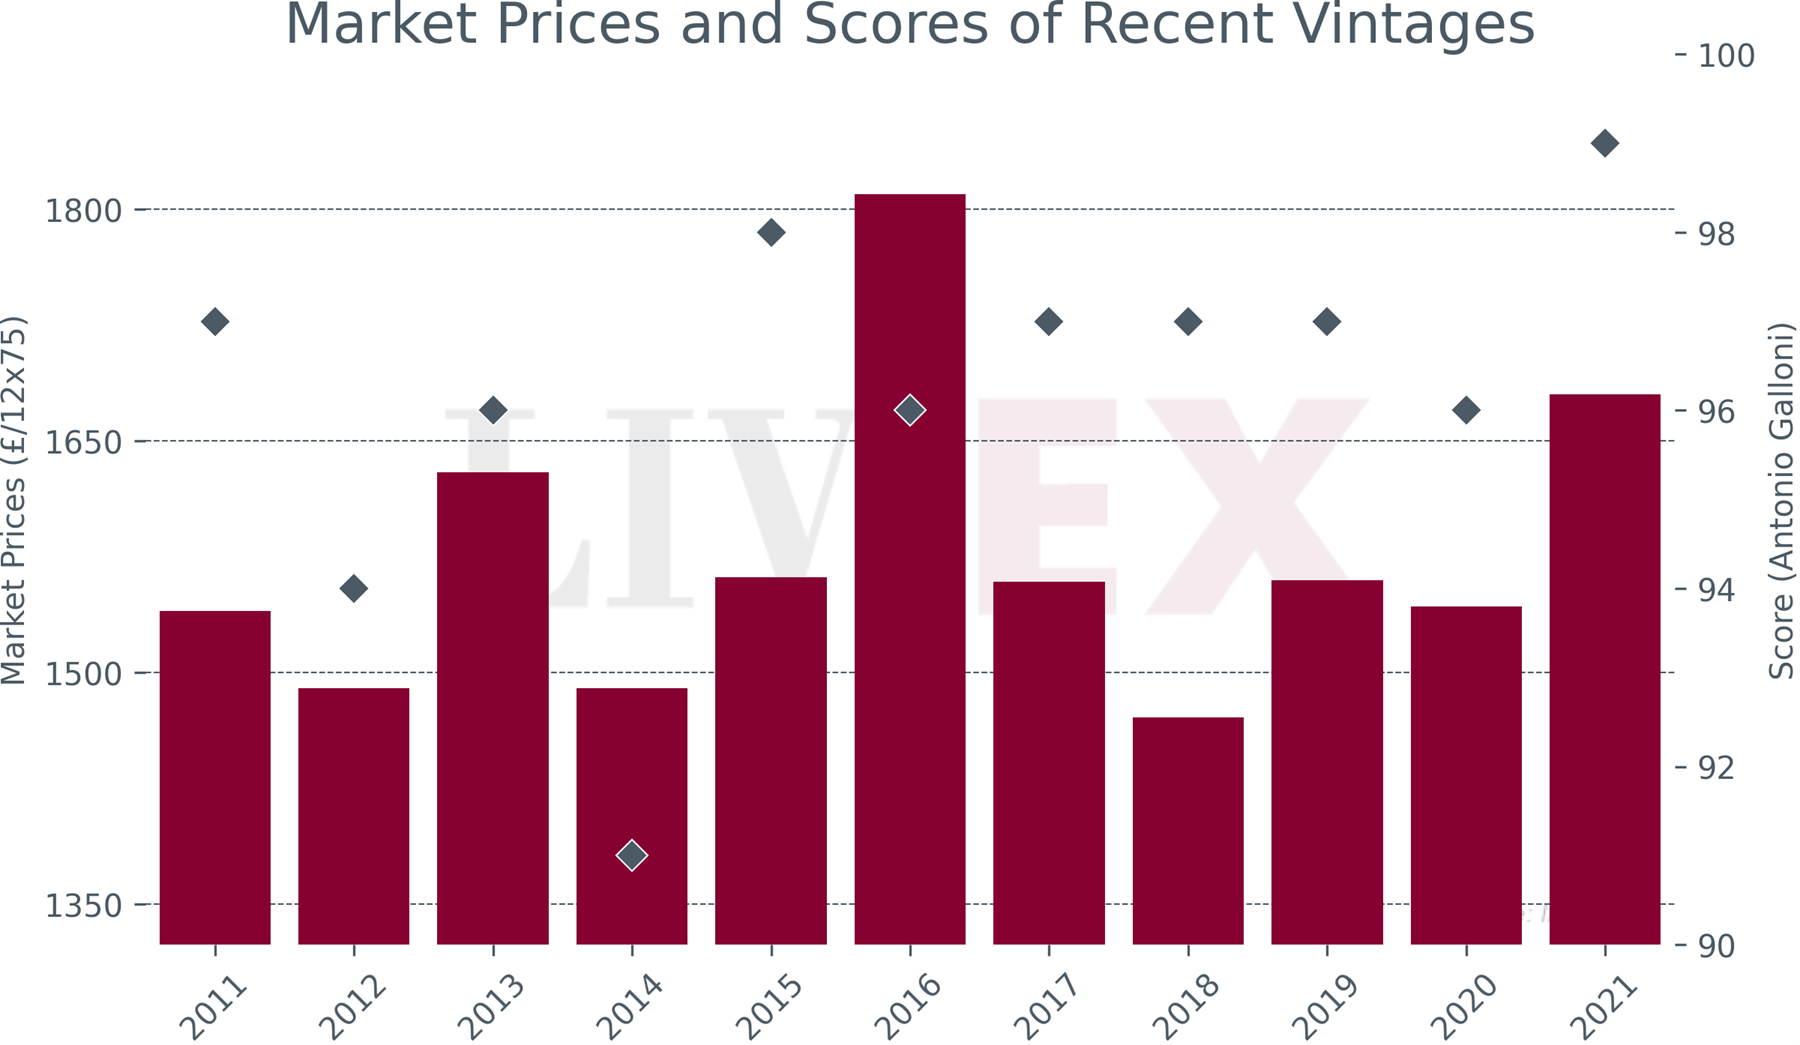
For better rated vintages, support is likely to be found at higher prices. The 2011, rated 97 points by Antonio Galloni (Vinous) has also seen trade this year close to its long-term trendline at £1,480 per 12×75. For vintages that haven’t been on the market for long enough to have a long-term trend to fall back to, the £1,450-£1,550 zone presents as a strong support level to watch for.
Liv-ex analysis is drawn from the world’s most comprehensive database of fine wine prices. The data reflects the real-time activity of Liv-ex’s 620+ merchant members from across the globe. Together they represent the largest pool of liquidity in the world – currently £100m of bids and offers across 20,000 wines.