February Market Report
- All of Liv-ex’s major indices, except for the Italy 100, recorded declines in January. At these prices, buyers appear to be finding value — compared to December, trade count was up 12.3%, trade volume was up 37.0%, and trade value was up 13.4%.
- 410 of the Liv-ex 1000’s component wines saw their Mid Prices increase month-on-month — the highest number in the past year.
- Over the past 10 years, we have seen Bordeaux’s share of the market decline. Until 2019, the region accounted for the majority of annual trade value on Liv-ex. In 2024, Bordeaux accounted for 33.3% of traded volume and 36.2% of traded value. While continuing to lead the market, Bordeaux is no longer the only key player.
- Nearly halfway through the third year of the current down-market, the wine trade is undoubtedly in need of respite. While set apart by its breadth – none of the Liv-ex 1000 sub-indices has been immune – there are historical instances of this kind of cycle that we can draw inference from. We turn to the Fine Wine 50 from 2009-2014 for hints as to when and how the market might recover this time around.
Introduction
All of Liv-ex’s major indices, except for the Italy 100, recorded declines in January. All indices are now down over the past one-year and two-year periods. 10 of the 18 indices are down over a five-year period.
The Liv-ex Fine Wine 100, the industry leading benchmark, fell 0.4% in January to close at 326.1.
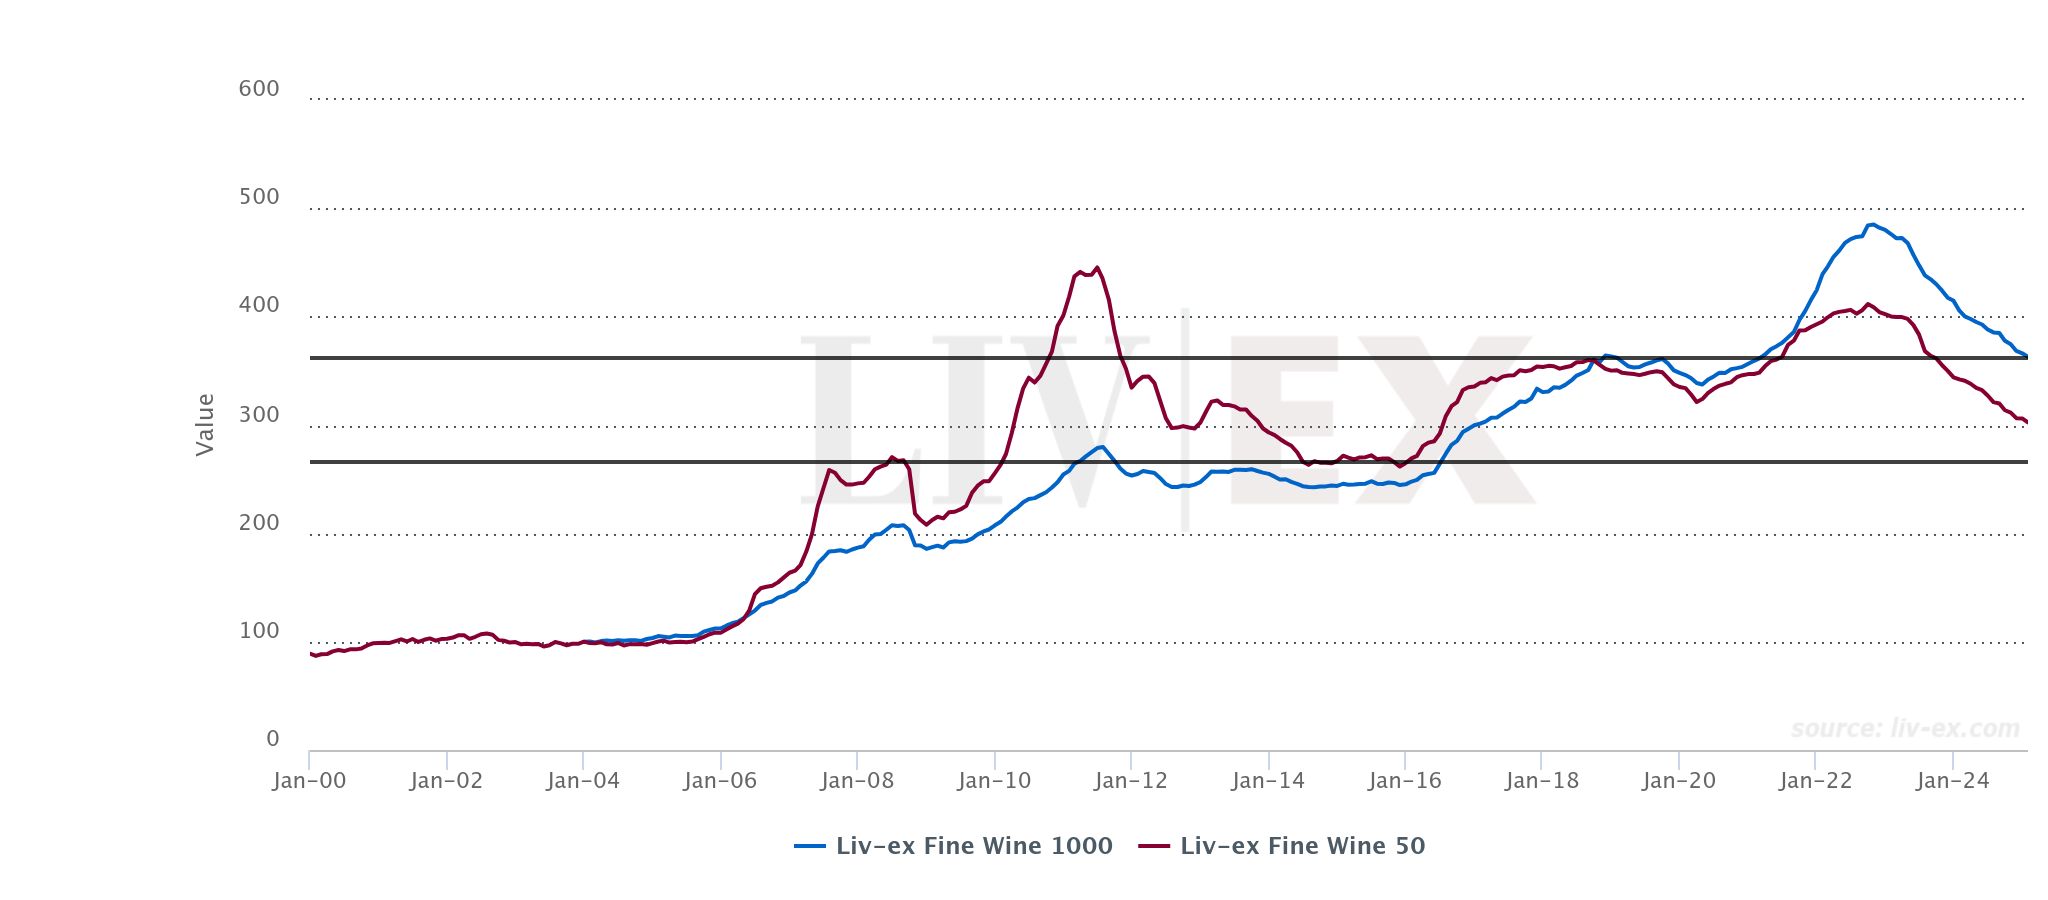
Looking at the wider market, the Liv-ex Fine Wine 1000 (which tracks 1,000 wines from across the world), fell by 0.9%. The index closed at 362.9, down from its last close 366.2.
Bordeaux did not fare well in January. The Liv-ex Fine Wine 50 (which tracks the 10 most recent physical vintages of the First Growths) fell 1.0%.
The Second Wine 50 was the worst performing index, recording a 1.8% decline. Prices of the second wines included in this index rose disproportionately to their quality from 2008-2010 and failed to come down sufficiently in subsequent market downturns. Now, they are falling fast, already well below their 2010 peak, and approaching 2015 price levels.
The Italy 100 was the only Liv-ex index to record a rise in January – up 0.6% following its falter in December. The index has demonstrated resilience to the broader market’s downturn, and with the Italy 100’s bid:offer ratio sticking above 0.5 and currently the healthiest of any index, it would seem that Italy might continue to hold up while others falter. While the Super Tuscans tend to appear more frequently amongst the week’s top –traded wines, it was largely Northern Italian wines that populated the list of best month-on-month price performers. Notably, only one vintage of Gaja’s Barbaresco – the 2019 – recorded a price decrease (down 0.6%).
After December’s festivities, January saw a notable uptick in activity. Compared to December, trade count was up 12.3%, trade volume was up 37.0%, and trade value was up 13.4%. A more interesting comparison can be made with January 2024, with trade count up 23.6%, volume up 41.5% and value up 13.0% compared to last year.
Risers:fallers ratio
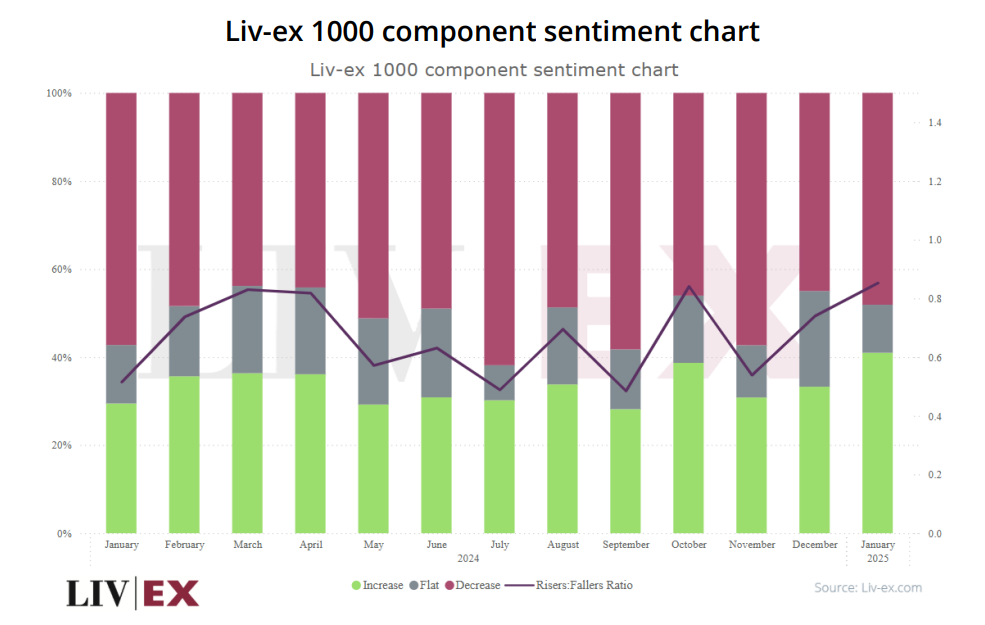
While the Liv-ex 1000 is down another 0.9% this month, 410 of its component wines saw their Mid Prices increase month-on-month — the highest number in the past year. 109 component prices were flat on last month and the remaining 481 saw price decreases. Bearish sentiment prevails, but a steadily increasing number of wines are seeing month-on-month rises.
Fewer wines fell flat month-on-month in January than in the final months of 2024. As many of Liv-ex’s major indices approach key support levels – whether 2015 or 2020 lows or earlier peaks — we are seeing more decisive price movements for individual wines. While breaks below these support levels may not ring as good news, market uncertainty can only prolong suffering. In other cases, support levels are holding, with prices bouncing upwards, albeit slightly.
Market share by traded value
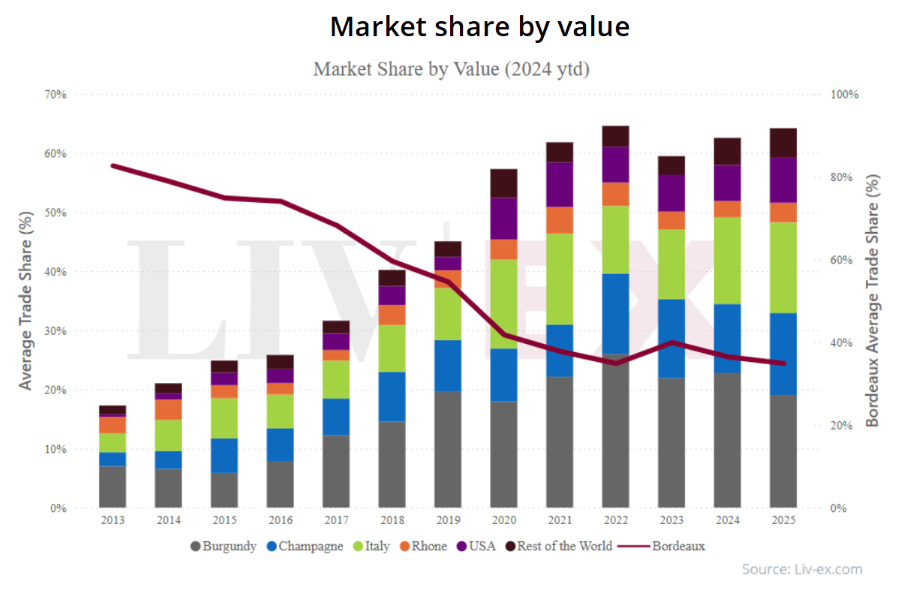
Over the past 10 years, we have seen Bordeaux’s share of the market decline. Until 2019, the region accounted for the majority of annual trade value on Liv-ex. In 2024, Bordeaux accounted for 33.3% of traded volume and 36.2% of traded value. While continuing to lead the market, Bordeaux is no longer the only key player.
This is not the case across all buyer segments, however. Bordeaux accounted for 47.2% of all EU buyers’ purchasing and 48.0% of all Asia buyers’ purchasing.
US buyers, playing an increasingly important role in market, have been instrumental in diversifying buying habits. In 2024, they were largest buying segment for Italy and Spain, two of the fastest growing regions on the secondary market. Amongst several other regions, US buyers are also the largest buyers of Bordeaux, despite the region making up only 31.9% of their purchasing.
Burgundy has been consistently propped up by UK buyers, for whom the region has accounted for c.30% of their purchasing since 2021. In 2024, they accounted for 42.6% of Burgundy purchasing. Year-on-year, UK buyers have taken smaller share of overall purchasing, partially accounting for Burgundy’s recent dip in market share.
How does this downturn compare to previous cycles?
Nearly halfway through the third year of the current down-market, the wine trade is undoubtedly in need of respite. While we cannot know for certain where and when prices may find their floor, turning to previous market cycles can provide us with some precedence of what to expect.
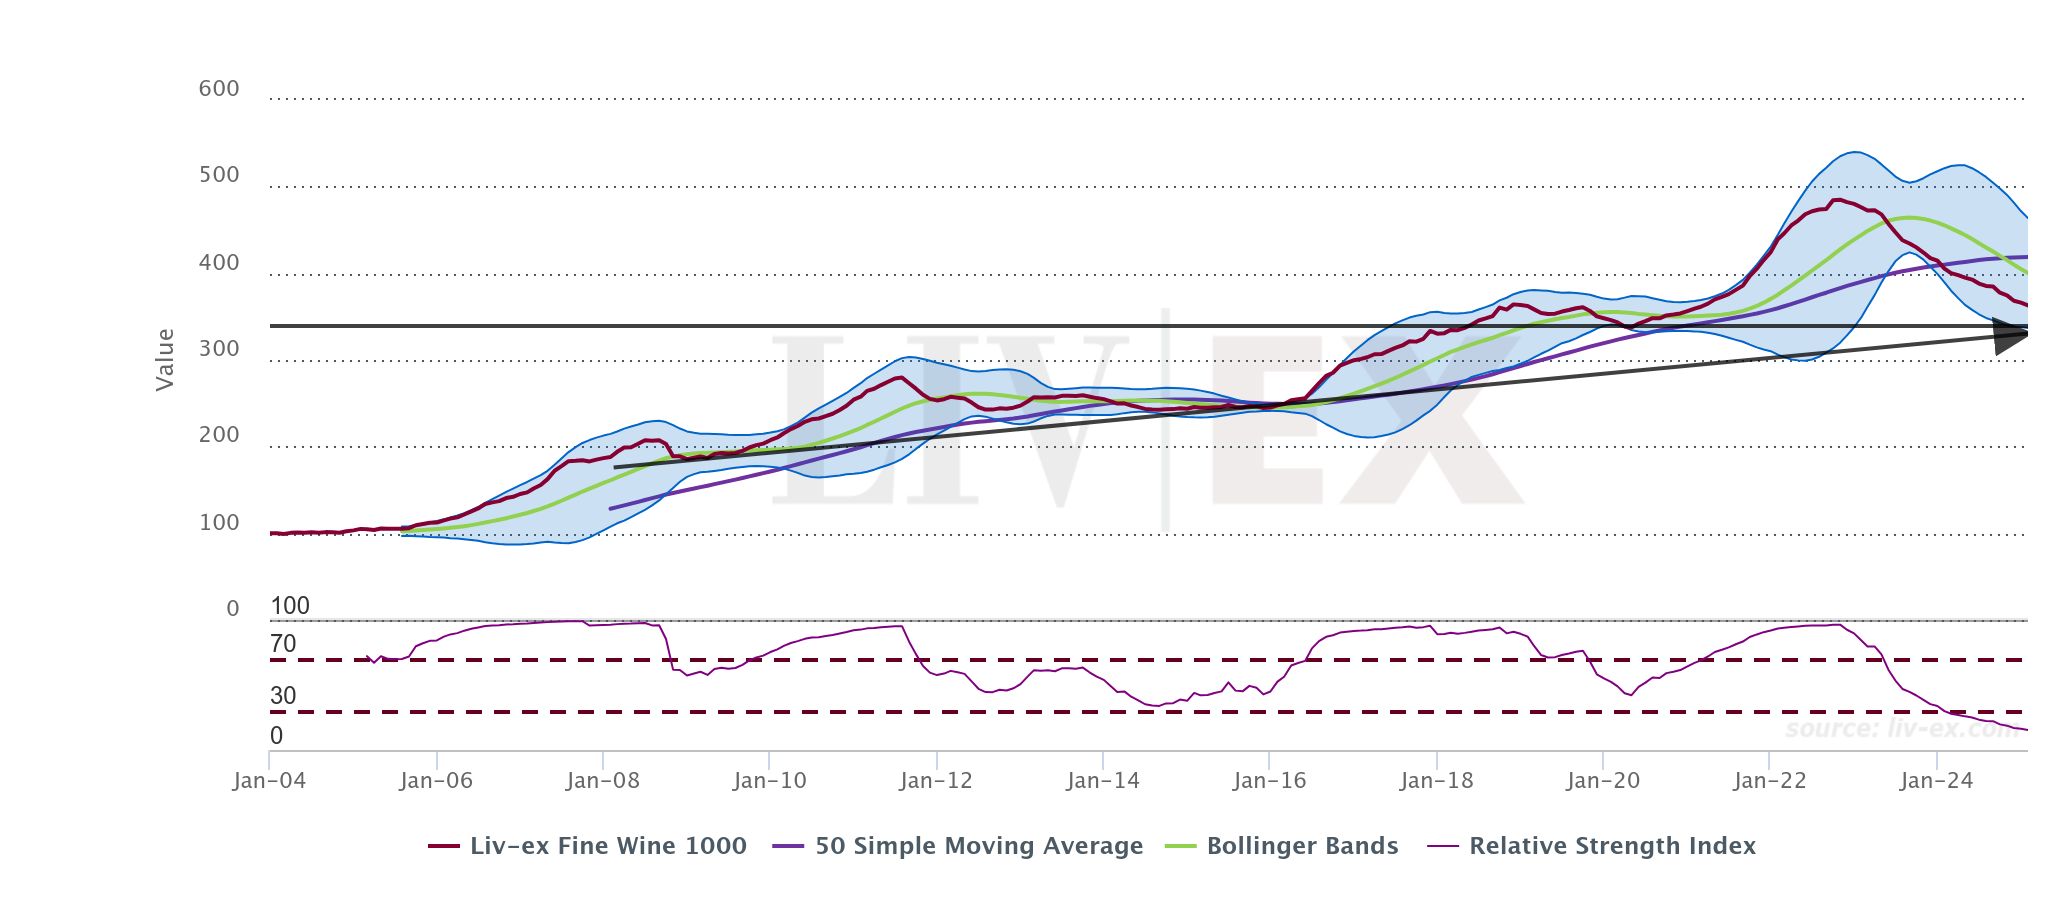
The Liv-ex Fine Wine 1000 over time

From May 2020 to November 2022, the Liv-ex Fine Wine 1000 rose 43.7%. In length and gradient, this upmarket was not dissimilar to those of 2016-2019 and 2009-2011, albeit more extreme. The current downturn, however, appears harsher and more prolonged than any historical examples. Before now, the Fine Wine 1000 had never fallen by more than 13.2% nor had downturns lasted for more than 13 consecutive months.
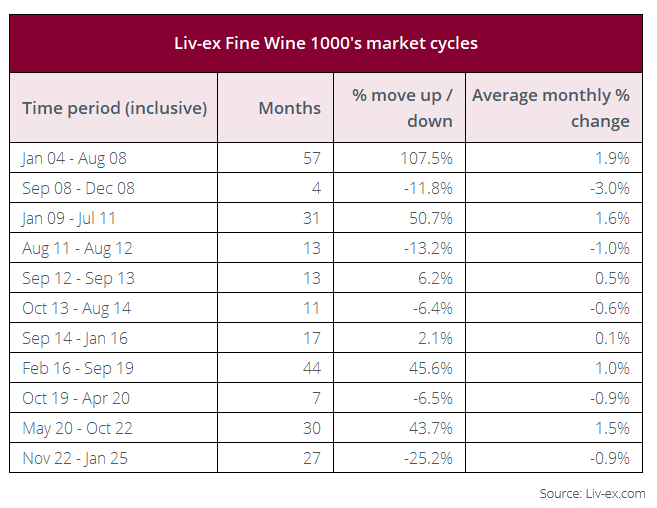
At a more granular level, certain sub-indices have indeed seen downturns of equal magnitude and length. While this current downturn is set apart by its breadth – none of the Liv-ex 1000 sub-indices has been immune – there are historical instances of this kind of cycle that we can draw inference from.
Lessons from the Fine Wine 50
During Bordeaux’s 2009-2011 bull run, the Fine Wine 50 rose 113.9%. This dramatic rise was partially justified by high demand, driven largely by a very active Chinese market. Bordeaux’s First Growths capitalised on this surge in demand by ramping up release pricing. The ex-London release price of Chateau Lafite Rothschild, which proved especially popular, increased from £1,850 per 12×75 for the 2008 vintage to £11,000 for the 2009. This pricing proved overzealous. Once the Chinese market withdrew, secondary market prices began to fall, and only stabilised once they’d reached their pre-boom prices – a phenomenon exemplified by the 2005 vintage shown below.
Liv-ex trades of Chateau Lafite Rothschild 2005
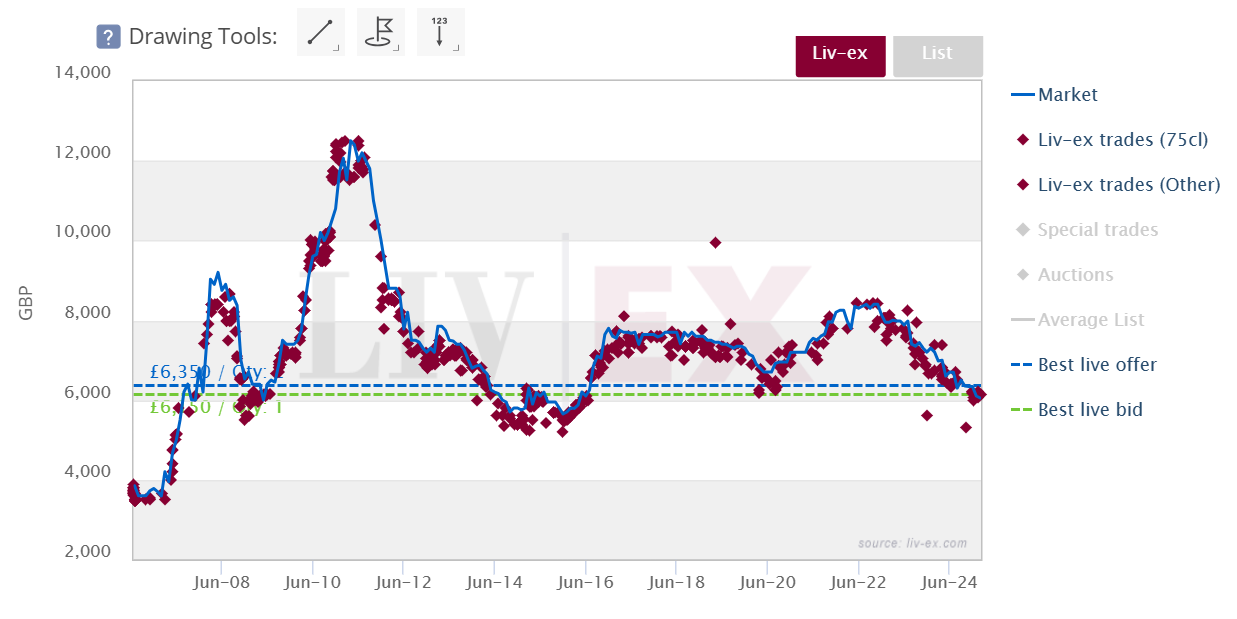
The Fine Wine 50 took time to recover, quickly retracing 47.6% of its initial move up from July 2011 to January 2012, but eventually finding its floor in 2014, at its 2008 peak (a 76.4% retracement).
Just as Bordeaux’s price hikes were driven by a seemingly insatiable demand from China, the steep rise of the Liv-ex 1000 in 2020 was driven by external intervention — monetary easing and the changing of consumer habits during COVID-19 lockdown. In this sense, both the 2009-2011and 2020-2022 bull runs were artificially created, driven by external factors and exaggerated by release pricing.
In other words, while we should expect to see long-term upward trends in the fine wine market, spikes of this magnitude were unsustainable.
Just as the Fine Wine 50 and other affected indices returned to pre 2009 levels within three years of peaking, we have seen prices of many wines return to pre-Covid levels. In a more positive view, if the Liv-ex 1000 behaves similarly to the Fine Wine 50 post 2009-2011, it may well hold at its 2018 peak (drawn above). Should it not, its 2020 low, which converges with both its long term trendline and its Lower Bollinger Band, presents as a compelling support, 7.7% below the index’s current level.
What happens next?
Following the lengthy 2011-2013 downturn, prices did not immediately rise. Having lost considerably on Bordeaux purchased at or near the peak, merchants were understandably reluctant to commit to price increases. A recovery period was needed before prices could rise once again. They remained stubbornly unmoved for over a year. While no other region saw such pronounced price increases, all fell victim to the stagnant period that followed.
Though more bullish market participants may be hoping for a swift price recovery in the coming months and years, a sideways moving market may be a blessing in disguise. With a growing need to draw in the next generation of fine wine consumers, a period of price stability could be the remedy required to clear out an excess of stock.
Some of the Liv-ex 1000’s sub-indices will have further yet to fall before their components present value to buyers, but in some cases, and at the broadest level, key support levels are in sight.
Liv-ex analysis is drawn from the world’s most comprehensive database of fine wine prices. The data reflects the real-time activity of Liv-ex’s 620+ merchant members from across the globe. Together they represent the largest pool of liquidity in the world – currently £100m of bids and offers across 20,000 wines.