October Market Report
Introduction – the decline accelerates
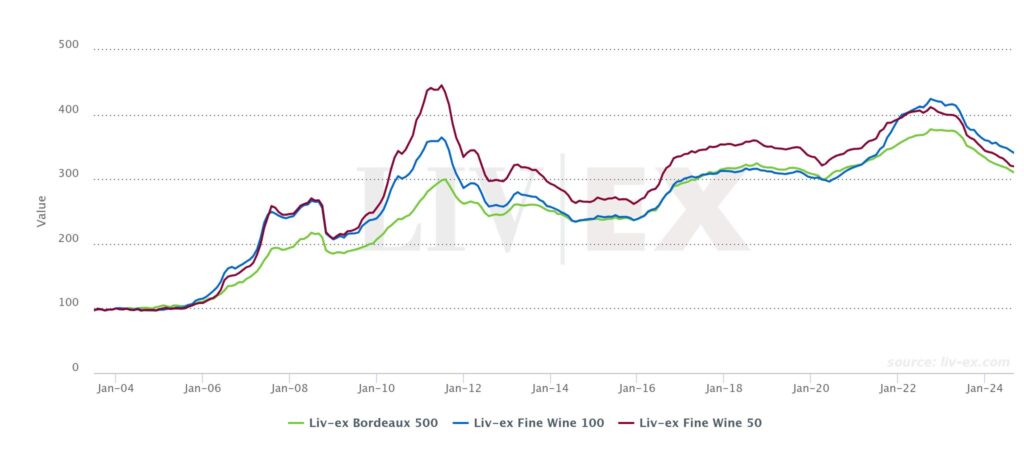
September saw the fine wine market’s downturn pick up pace. The Liv-ex Fine Wine 100, the industry leading benchmark, fell by 1.7%, its sharpest month-on-month decline since October 2023. It is now back at the level it was in May 2021, 21.0% below its peak in September 2022, but still 13.1% above where it was before the 2020-2022 bull run.
The Liv-ex Fine wine 50, which tracks the performance of the 10 most recent physical vintages of the Left Bank First Growths, fell 2.1% during September, and is now below its 2020 levels.
Meanwhile, the Liv-ex Fine Wine 1000 (which tracks 1,000 wines from across the world and is the broadest representation of the market), fell 1.9%.
After the northern hemisphere summer lull, market participation increased in September. The number of trades increased 12.9% compared to August. With the number of buyers also reaching its highest level in seven months towards the end of September, it appears that the accelerated price decreases might be enticing bids.
State of the market – Average list vs Market prices
It is no secret that the fine wine market has been bearish since October 2022. With the acceleration of downward movement this month, it would seem that there is still a way to go before the market turns the corner. And yet, we continue to see high release pricing out of Bordeaux and list prices remain head and shoulders above the market. There appears to be a disconnect at each level. To gain an understanding of the behavioral interactions between the primary and secondary market, we have conducted an analysis of the varying difference between Market Prices and Average List Prices of the Bordeaux First Growths over time.
In the chart below, the Liv-ex Fine Wine 50 is represented by the dotted line. The average difference between Market Price and Average Listed Price for the 2005 vintage of the First Growths (minus Château Latour) is represented by the grey line. To capture broader trends rather than spikes, we have opted for a 3-month rolling average. In general, we observe an inverse relationship between the index and the price differential — in upward moving markets, the Average List Price falls closer to Market Price than in downward moving markets.
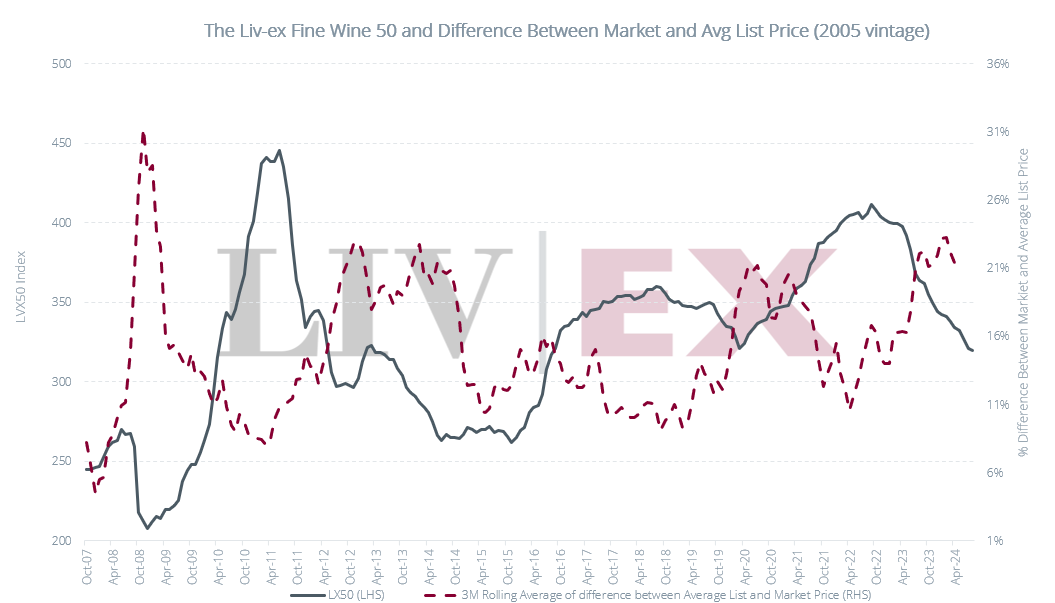
Merchants are less responsive to downward movement in the market than they are to upward movement. While understanding that the market is bearish, many will continue to list their stock at a historically high level. This is especially true now – the difference between Market Price and Average List Price is higher than ever across all vintages. At the peak of the market in April 2011, for example, the average list price for Château Lafite 2005 was 6% higher than the Market Price. By February 2013, the Average List Price sat 25% above market. As of today, it is listed, on average, 34.1% above its Market Price.
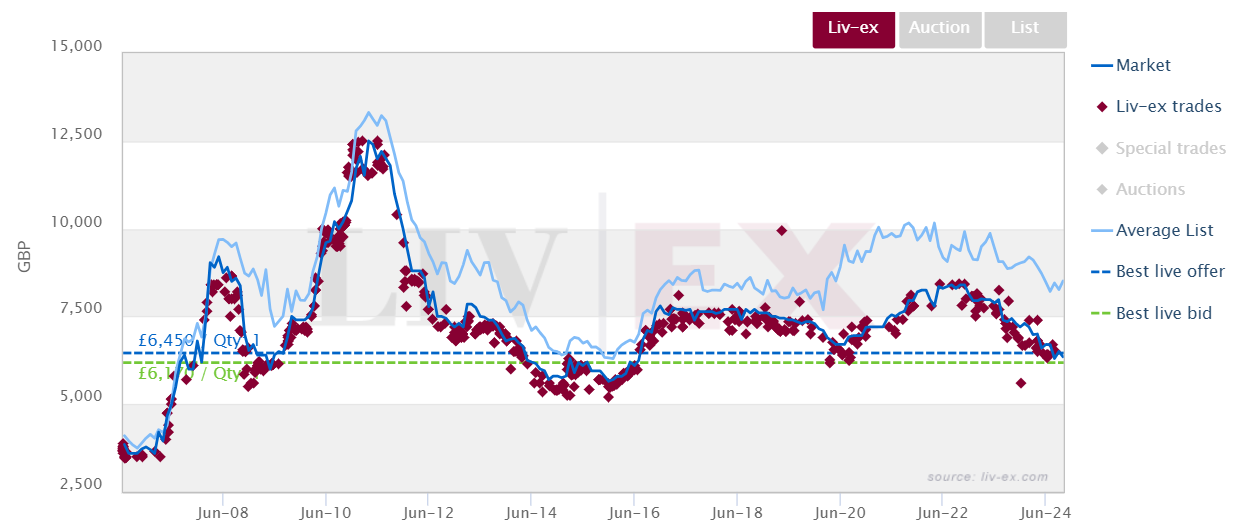
Liv-ex trades of Château Lafite Rothschild 2005
What’s driving the difference?
The graph below shows the Average List and Market Price for the First Growths (minus Château Latour). All vintages including and after 2005 have been included, to account for scarcity-based volatility.
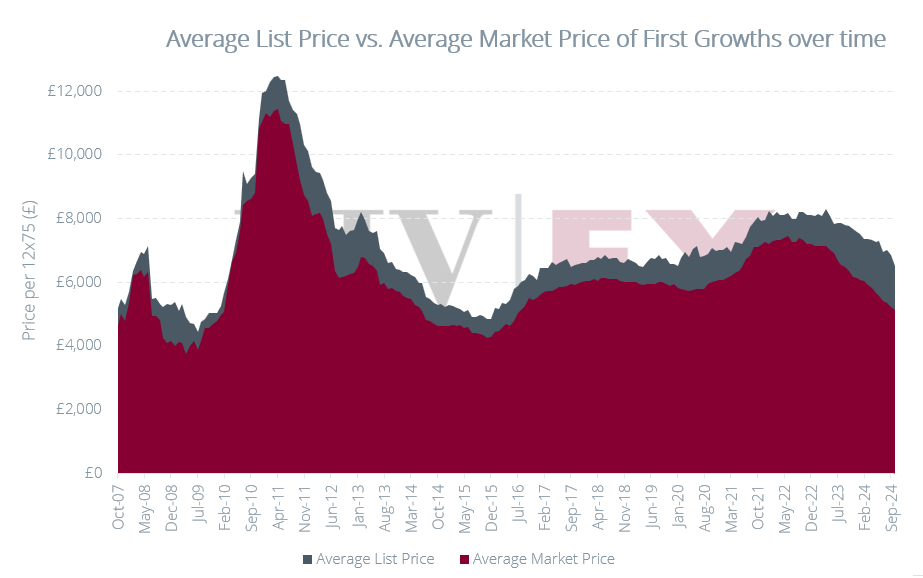
The relative flatness of List Prices in recent years is apparent in the graph above. Though we can observe a widening of the gap during all down markets, this effect is especially prolonged and pronounced currently. Prior to 2018, average list prices were more reactive to both upward and downward momentum in the market.
With a large stimulus provided soon after lockdowns were enforced in March 2020 and drinking habits changing during the Covid-19 epidemic (consumers more willing to spend on wine to consume at home), Average List Prices were not forced down to align with the market before it gained upward momentum. This time around, merchants haven’t been so lucky.
In 2011, we observe similar resistance to market conditions, followed by two successive steep drops in Average List Price prior to recovery. List Prices similarly had to adjust down in 2009. There tends to be a sharper fall for Average List Prices than for Market Prices. When enough merchants drop their prices, so too must their competitors if they want to retain customers. Over September, Average List Prices fell more sharply than Market Prices (5.1% vs 1.5%) — the largest month-on-month narrowing since April 2021. This is likely a sign that merchants may now be feeling the pressure to secure a competitive edge.
Inter-vintage variation
It would appear that the variation between Average List and Market Prices is greater for ‘on’ than ‘off’ vintages. It is possible that stockholders, collectively, are more willing to lower their margins on less sought-after wines. Should they need to make space in warehouses or free up capital, for example, they are more likely to offer their 2013s and 2017s at a discounted rate than their 2010s and 2016s. When the market turns, it is likely the great vintages that will return higher nominal margins.
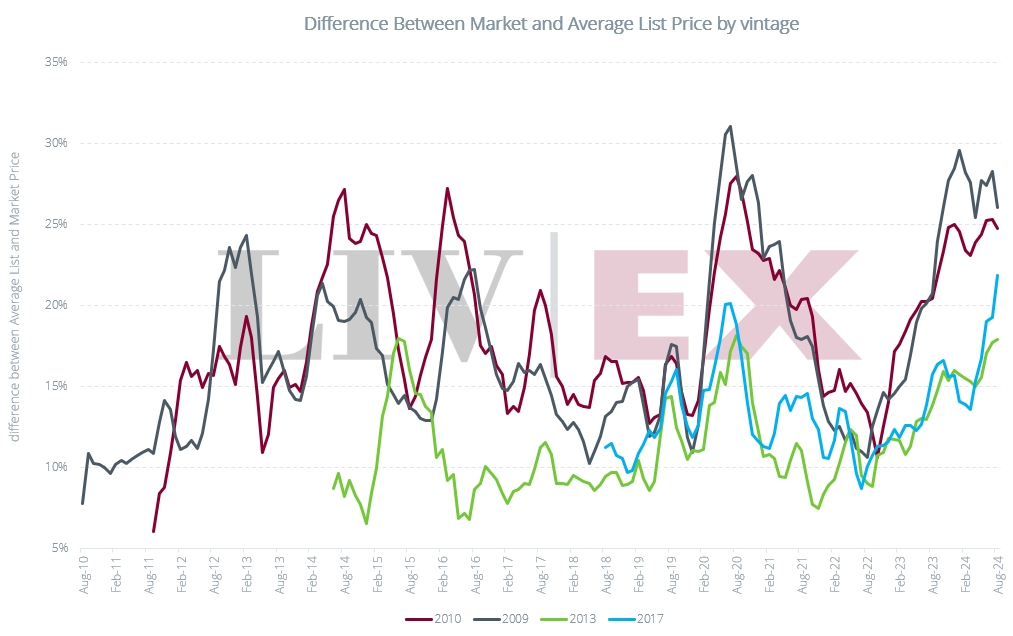
The differential could also be responsive to release pricing. The 2010 vintage, for example, was a turning point in En Primeur pricing. Emboldened by a very active Asian market from 2009-2011 and highly acclaimed 2009 and 2010 vintages, châteaux more than doubled their release prices over the course of two years. Overzealous pricing results in low margins for merchants buying En Primeur. As such, some may be unwilling to drop their prices below cost, driving a wedge between list pricing and market pricing. Châteaux are more likely to price their middling or ‘off’ vintages closer to the market. Thus, to make a final profit on ‘off’ vintages, merchants need not list much higher than the market. Even so, we have recently seen trade prices of both ‘on’ and ‘off’ Bordeaux vintages break below ex-château supports. Lafite 2016 and Mouton 2017, for example, are both currently on offer at or below their ex-château release prices. Though disheartening to sell below cost, it pays to be an active participant in the market.
Holding wine is not an inexpensive undertaking. For private clients, the cost stands at around £15 per case annually. While lower for merchants, there comes a stage at which the cost of storing wine outweighs the cost of accepting a sale price lower than purchase cost. Merchants cannot simply pause sales during a down market – to keep any business running, cash flow needs to be generated, sales need to be made. Prices must be low enough to attract buyers. Eventually, average list prices will drop closer to the market. While they doubtless have further to fall, in some cases, the gap is already beginning to narrow.
Liv-ex trades of Château Lafite Rothschild 2020
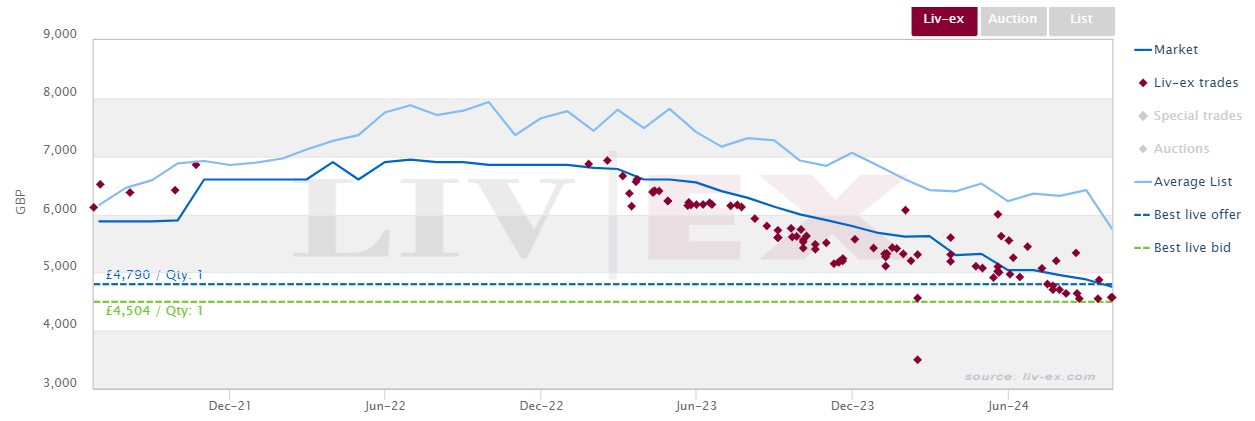
When the gap narrows sufficiently, prices on the primary market will eventually fall low enough to present value to buyers, thereby reinvigorating the secondary market. With Average List Prices so high, market participants are presented with an opportunity – it is not difficult, at this stage, to price lower than competitors. In nominal terms, margins may be smaller than in more profitable years, but those who are first to lower their prices will be those to secure buyers.
Conclusion – so where does that leave us?
The acceleration of the decline of the Liv-ex indices may not ring as cheerful news, but it does indicate that the market is coming to terms with its downward momentum. Finally, sellers who have been holding offer prices are dropping down to meet bidders. This is reflected in the recent narrowing of the gap between Average List and Market Prices. This has been effective – the final week of September saw the highest number of unique buyers on the market since February. Demand exists at the right price, and it is this demand that will eventually allow prices to recover.