September Market Report
Introduction – the market downturn continues
All major indices fell during August. The Liv-ex Fine Wine 100, the industry benchmark, fell 1.0%, similar to its July fall (-1.1%). It has now fallen 5.4% year-to-date.
The Liv-ex Fine Wine 50, which tracks the ten most recent vintages of the Bordeaux First Growths, fell 0.6% during August.
The wider market, represented by the Liv-ex Fine Wine 1000 (which tracks 1,000 wines from across the world), fell 0.1%. Within the Fine Wine 1000, certain sub-indices fared better than others. The Rest of the World 60, which tracks the ten most recent physical vintages of six wines from Spain, Chile, USA, and Australia rose 0.8%. So too did the Rhône 100, Burgundy 150, and Champagne 50 record modest rises (up 0.5%, 0.2%, and 0.1% respectively).
There was, however, an uptick in trade towards the backend of the month, with 55.0% of trade by value taking place in the second half.
August also saw a rise in the number of unique brands (LWIN7s) and wines (LWIN11s) traded (9.8% and 9.9% respectively).
Index Insight – Rest of the World 60
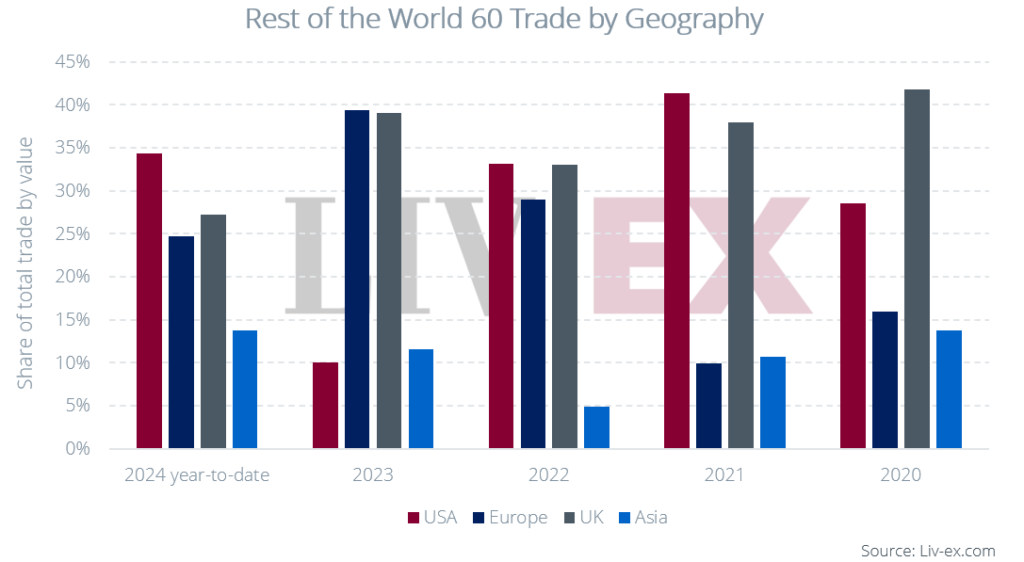
The Rest of the World 60 rose 0.8% during August. As the chart below shows, over the long-term it has tended to record steady growth, having been less impacted by wider market trends that have played a significant role for more established regions like Bordeaux.

When we look at which merchant geographies are driving demand within the index, we can see that in 2024 US merchants have been significantly more active than during 2023, contributing 34.4% of the total trade value year-to-date compared to 10.0% during 2023. In August alone, US merchants were responsible for 64.0% of total trade value for the index.
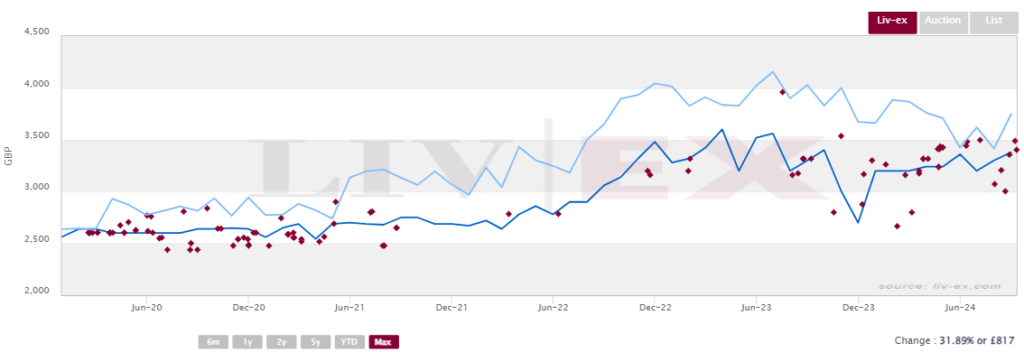
The value of Vega-Sicilia Unico components bought by US merchants so far this year is over three times above what it was last year. Vega-Sicilia Unico 2010 is the best-performing component in the index, having risen 29.4% year to date, and 13.1% in August alone. The chart below shows a noticeable uptick in trading so far this year, much of which has occurred close to (and often above) market.
Critical Corner – the impact of ratings on prices by cru
Liv-ex has recently undertaken a significant analysis of the relationship between critics’ ratings and prices. One aspect of this has been to examine the impact of ratings on the prices of different wine categories. This offers great insight to where critics hold the most sway.
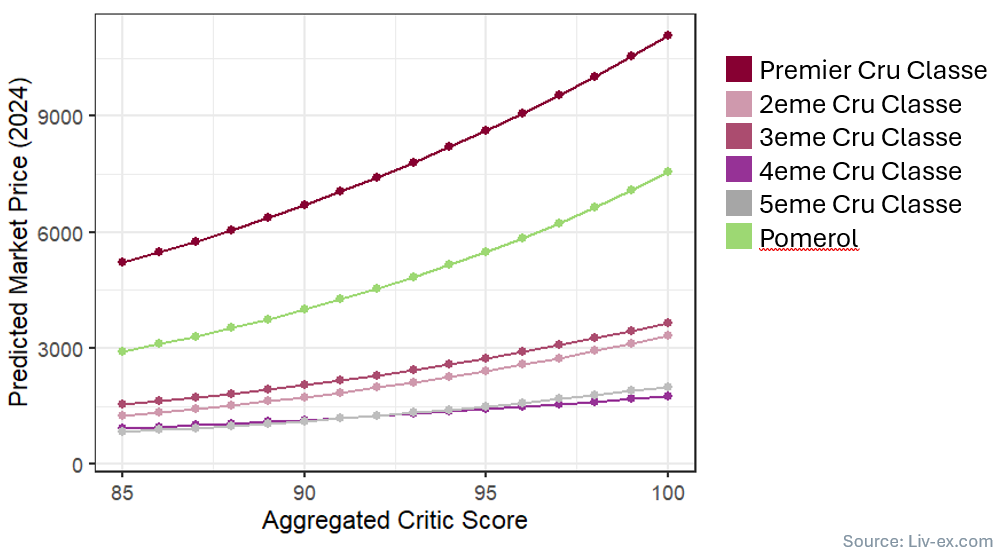
Bordeaux is an interesting case. As we know, Robert Parker’s ratings (and their subsequent impact on demand for wines) inspired a stylistic change within the region. While the critical landscape is more fragmented following Parker’s retirement, ratings continue to have a considerable impact on pricing. However, critics’ ratings do not have an equal impact across classifications nor across the ratings scale. Below we show the relationship between critic score and price for components of the BDX500, grouped by cru.
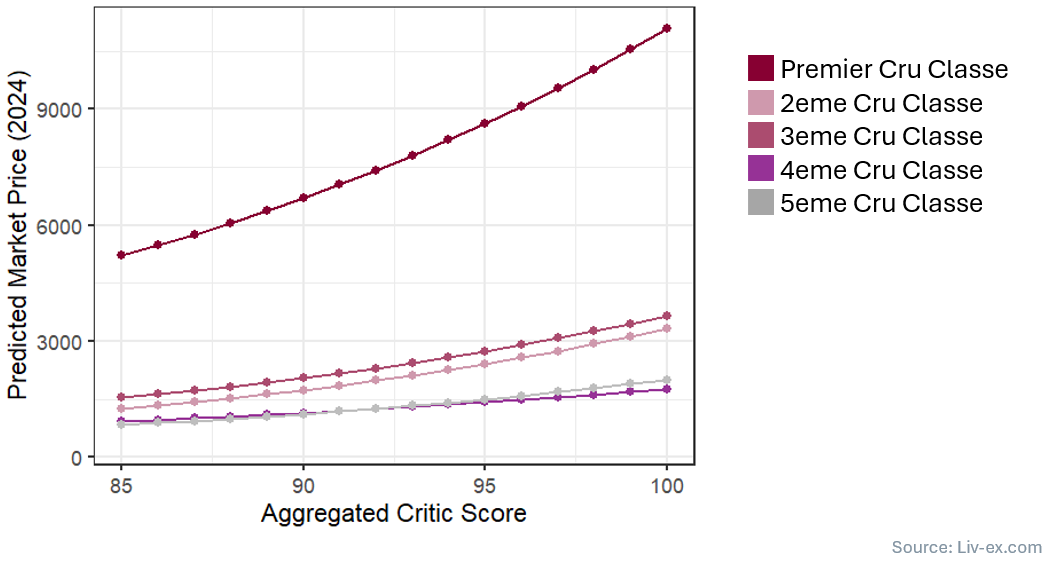
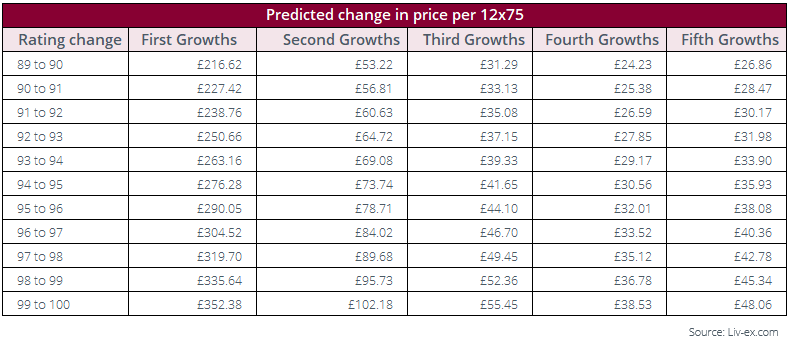
While prices tend to follow in line with the 1855 Classification, we can see that ratings have a greater impact in terms of cost per case the further we go up the scale. In other words, the price difference between 99 and 100-point wines is greater than that between 91 and 90-point wines.
Further, cru tends to hold more weight than rating. We can see this with the predicted absolute price increase for First Growths (here just the Left Bank First Growths) being greater than other crus. Crucially, price differences between crus compound the higher the rating.
Expanding the pool beyond the BDX500 and also adding Pomerol wines to the analysis, we see that the relationship between rating and price is similar between Pomerol and the First Growths. While cru is a factor for Left Bank wines, scarcity plays a significant role in Pomerol’s pricing.
There is an interesting comparison to be made between Burgundy and Bordeaux. Across the rating scale, the predicted price increase of Bordeaux First Growths for each additional rating point is significantly higher than for Burgundy Grands Crus (5.0% vs 3.1%). Moreover, the impact of 95+ point ratings on the prices of Bordeaux First Growths is greater than it is for Burgundy Grands Crus. The average price increase from a 97-point to a 98-point Bordeaux First Growth is £319, whereas it is £110 for Burgundy Grands Crus.
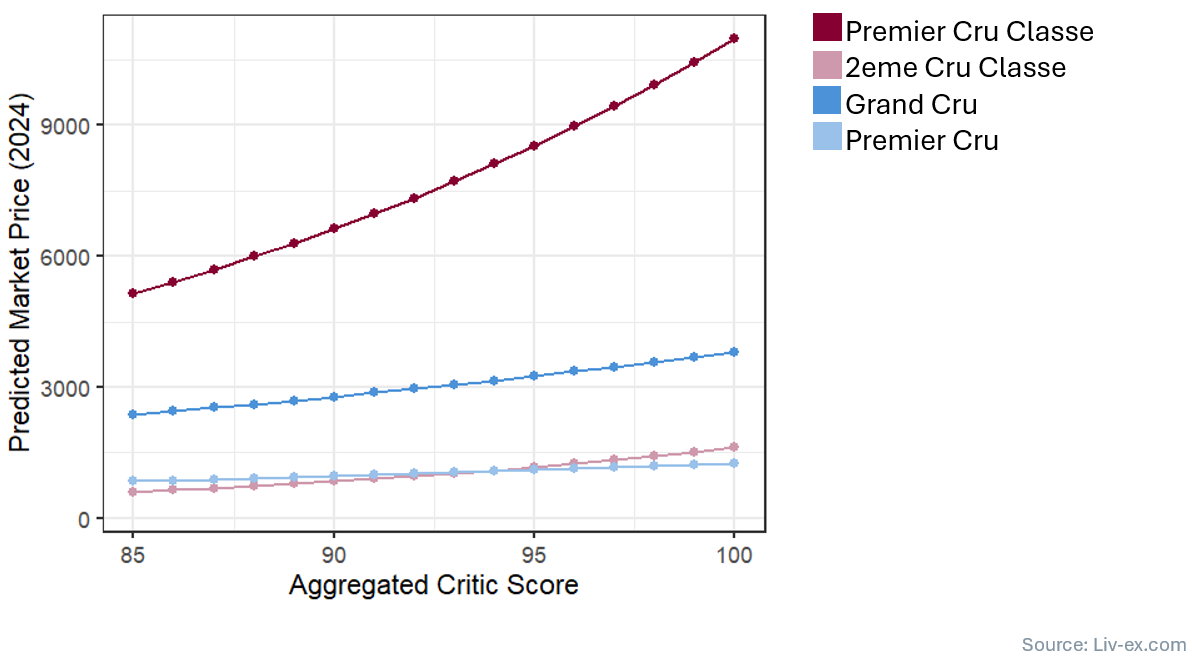
Similarly, within the next tier down, we see that increased critics’ ratings have more of an impact on Bordeaux Second Growths than for Burgundy Premiers Crus. While the average predicted price for a 94-point wine from each category is almost identical (£1093 vs £1076 per 12×75), a 98-point Bordeaux Second Growth would be expected to cost 18.3% more than a Burgundy Premier Cru.
Within Burgundy, similarly to in Bordeaux, the predicted price differences between crus become more significant the higher the rating. The price difference between Premiers and Grands Crus is £2,558 at 95 points, but £3,150 at 98 points
All data above is for wines that have a current Market Price and have been rated by at least three critics.
Chart of the Month – Technical Analysis of the Bordeaux Legends 40
The Bordeaux Legends 40, which tracks the price performance of a selection of 40 Bordeaux wines from exceptional older vintages, has been one of the very few Liv-ex indices to exhibit sustained growth or stability over the summer. Using technical analysis, we can assess the possible future movements of the index – has the index truly stabilised, or should we expect yet another downturn?

While the Bordeaux Legends 40 has maintained a long-term bullish trend since its inception in 2004, in December 2023 the index broke the long-term ascending trendline. Despite still sitting higher than it did in April 2020, it has retraced 76.4% of the gains it made since that low. The 76.4%-78.6% retracement zone represents an important resistance for proponents of Fibonacci mathematics. While not all are believers in this method of technical analysis, the index has exhibited consistent movement in line with Fibonacci numbers. In January 2020, the index rebounded at the 61.8% retracement level; in September 2012 at the 38.2% retracement level, and in January 2009 at the 23.6% level. Over the past three months, the index has shown some stability, trending upwards. We may understand this bounce as a test of 78.6% Fibonacci retracement level.
The index’s Relative Strength Index (RSI) has recently moved slightly upwards, but remains firmly below 30, deep into oversold territory. An RSI position under the 30 threshold is generally thought to generate a ‘buy signal’. The recent uptick may be evidence of this, prices having dropped low enough to provide value to buyers, and thereby increase demand. While we have seen an overall increase in the bid:offer ratio over the past three months, it fell towards the end of August. Though this may simply be a product of the summer slump, it may also indicate a wave of negative sentiment.
To assess the future movement of the index, we will need to closely monitor prices and their volatility. The index’s Bollinger Bands currently remain wide open and show no immediate signs of closing. Given that low volatility (a price squeeze) is understood as an indicator of a trend reversal, we cannot yet say with certainty that recent upward movements will persist.
If the index has indeed found support at the 76.4% Fibonacci retracement level and prices move upwards, we will watch to see how the index reacts against the SMA7, its next resistance level. If they break this resistance level, and the Bordeaux Legends 40 moves above its long-term trendline, the index may be out of the woods.
Should prices fall, however, they are likely to reach their 2021 lows – another 30 basis points below the index’s current position.
Final thought – September’s La Place releases so far
Last week saw the start of La Place de Bordeaux’s September releases. It is a tough market into which to be releasing wines. Perhaps in an effort to spark life into the campaign, it started with the 2021 vintage of heavyweights Opus One and Masseto. The ex-négociant price of Opus One 2021 was 2.0% above the 2019 (the last vintage released through La Place), and Masseto 2021 was flat on the 2020.
Opus One 2021’s international release price of £3,000 per 12×75 put it at the same level as the current market price of recent vintages. It was the top-traded wine by value last week, but as a sign as to what the market deemed a fair price for it, it was trading at £2,634 per 12×75, 12.2% below its release price.
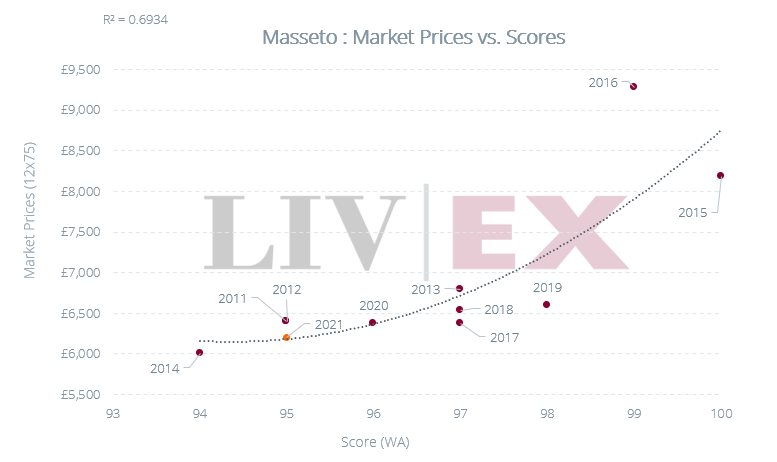
Masseto’s flat ex-négociant release price compared to the 2020 signalled some sympathy for current market conditions. However, as the chart below shows, for the 2021 to offer fair value, merchants would have to offer it at a maximum of £6,200, c.9% below the release price of the 2020 (c.£6,800). In short, merchants would have to reduce their margin. But given the margin that merchants have to play with, Masseto has so far proven a relative success.
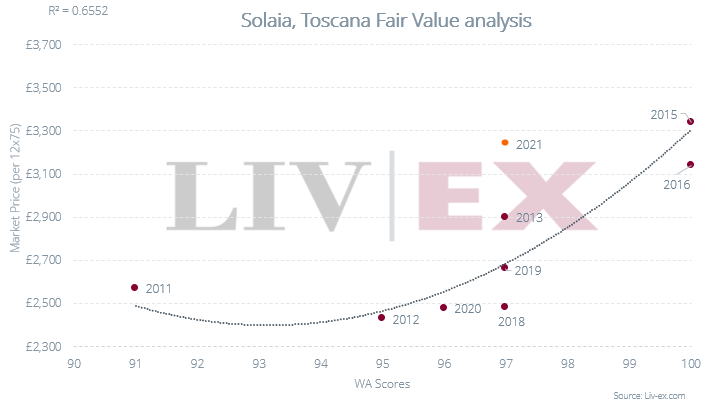
With the exception of a fairly priced Y d’Yqeum 2022 and Cheval des Andes 2021, releases since have generally been far from compelling. This has not tended to be due to increased release prices on last year. Rather it is because previous vintages have fallen significantly in value since release. For example, Seña 2021 has fallen 18.8%* since its release in September 2023. Maintaining the same release price for the 2022 has not made it an appealing proposition. For Solaia, the chart below shows that similarly-rated back vintages represented much better value than the 2021.
Read all our release analysis here.
*N.B. While the correct prices were listed, in the initial print this drop was erroneously calculated as 32.3%.