What’s happening in the market?
Bordeaux has continued to lead the market this week so far, taking 32.5% of traded value. Cheval Blanc was the top-traded producer in the region, followed by Château Pontet-Canet and Château Latour.
Tuscany has had a strong week so far, overtaking Champagne with a 14.6% share of trade. Masseto 2021 and Massetino 2022, both released last week via La Place de Bordeaux, have traded below their ex-London prices.
La Place de Bordeaux has now entered its second week of September releases. On Monday, Penfolds Grange 2020 and the Vérité 2021 collection were released, and on Wednesday, Galatrona 2022, amongst others. The general reaction has been muted at best with prices failing to reflect the market reality.
Today’s deep dive: bid-to-offer ratios of the Liv-ex Fine Wine 1000’s sub-indices
In recent months, we have been turning more frequently to bid-to-offer ratios in our analysis as a measure of market sentiment. In late August, for example, we reported on the bid:offer ratio of the Italy 100 and its component wines. Today, we take a broader look at market sentiment, comparing changes in the bid:offer ratios of the Liv-ex 1000’s sub-indices over the past two years. Rather than using monthly averages, we have opted for a 3-month rolling average, to help capture the broader trends rather than spikes.
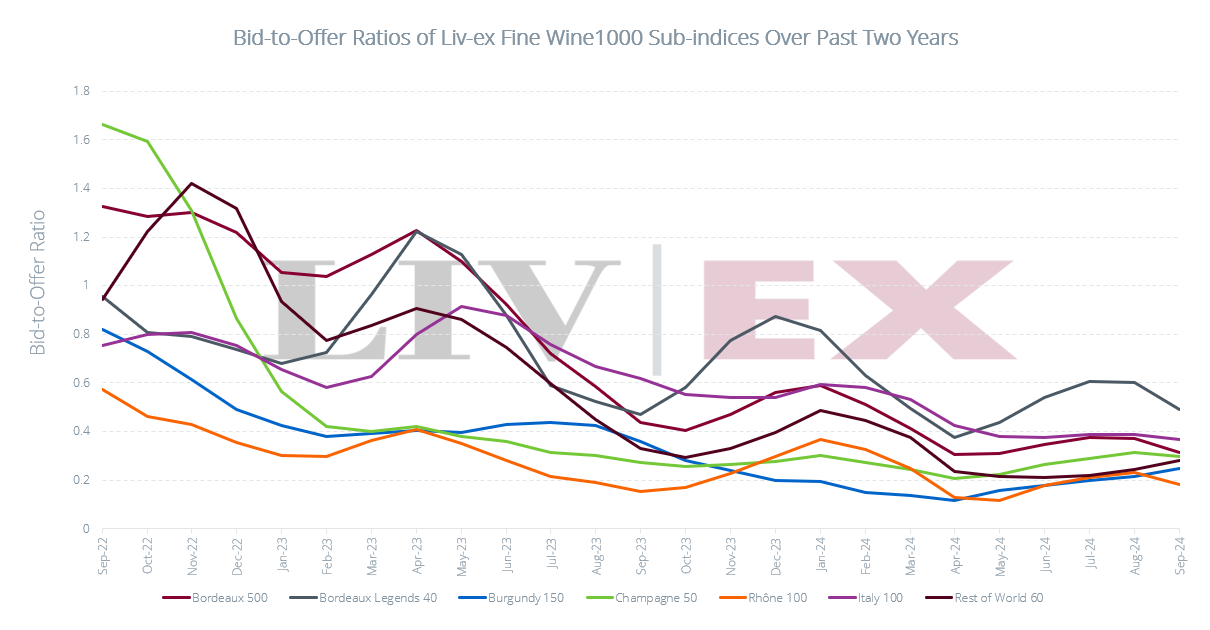
Given the market’s current downward momentum, it should not come as a surprise that the ratios for all sub-indices have all remained below 1 since mid 2023.
The Bordeaux Legends 40 currently boasts the highest bid-to-offer ratio of the Liv-ex 1000’s sub-indices, but its ratio has also exhibited the highest volatility. While this volatility seems to be progressively decreasing, movements upward or downward are not yet predictable. Moreover, the index has been steadily moving downward for some time, only recently stabilising (as reported in more depth in our September Market Report).
The Italy 100 has the second highest bid:offer ratio of the sub-indices, and has exhibited much lower volatility. By contrast to the Bordeaux Legends 40, which has dropped by 13.6% September 2023, the Italy 100 has been relatively stable, falling only 6.6%. Since May this year, the latter’s bid:offer ratio has remained relatively constant.
It is also notable that Bordeaux and Italy lead the market in terms of traded volumes. While Burgundy has taken 22.7% of traded value in 2024, the region only accounted for 16.0% of traded litre volume. Italy has accounted for 14.6% of traded value, and 21.5% of volume. Bordeaux and Italian wines, in general, are produced in high volumes and trade frequently. In other words, they are the most liquid regions on the exchange. Higher liquidity provides market participants with higher confidence levels – even during a down market, buyers can be more certain a wine they purchase will resell easily and at a non-volatile price. Still, the Bordeaux Legends 40, composed of excellent older vintages, is inherently less liquid than the Bordeaux 500 and Italy 100.
The Champagne 50’s ratio fell sharply from September 2022 to October 2023, predating the index’s fall in November 2022. The ratio appeared to bottom out in January 2023, exhibiting milder increases and decreases since then. This is largely reflected in the index, which has fallen in line with the broader market since January 2023, following a much sharper decline in late 2022.
Liv-ex 1000 sub-indices
While the bid:offer ratio for each index fluctuates more regularly than the index itself, the overall pattern remains clear – those with the highest bid:offer ratios have performed the best overall over the same time period.
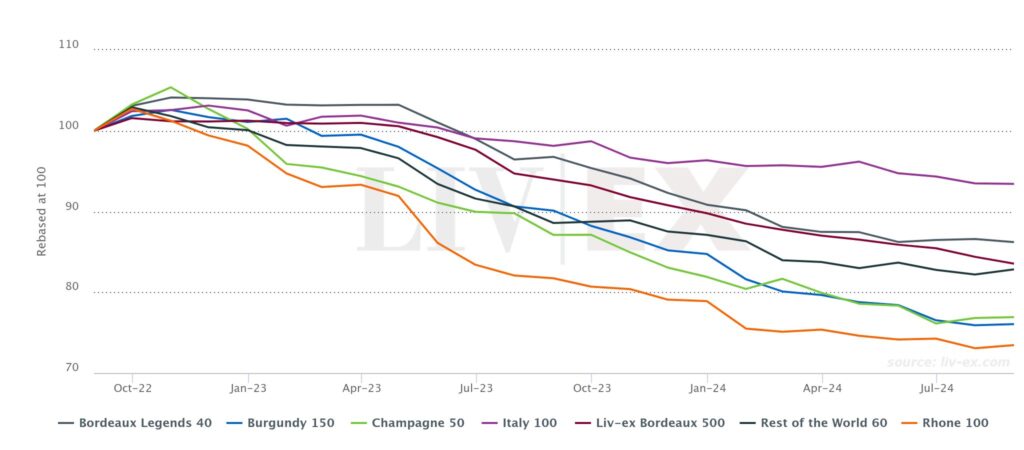
We have previously hypothesised that though the time lag between deteriorating market sentiment and falling prices is lengthy (ranging from six months to a year), improved market sentiment has an almost immediate effect on prices. The Burgundy 150 and Rest of the World 60 are the only two sub-indices to have exhibited consistent rises in their (rolling average) bid:offer ratios over the past quarter. These two sub-indices are two of only four to have recorded month-on-month rises in August (0.2% and 0.8% respectively).
Liv-ex analysis is drawn from the world’s most comprehensive database of fine wine prices. The data reflects the real time activity of Liv-ex’s 620+ merchant members from across the globe. Together they represent the largest pool of liquidity in the world – currently £100m of bids and offers across 20,000 wines.