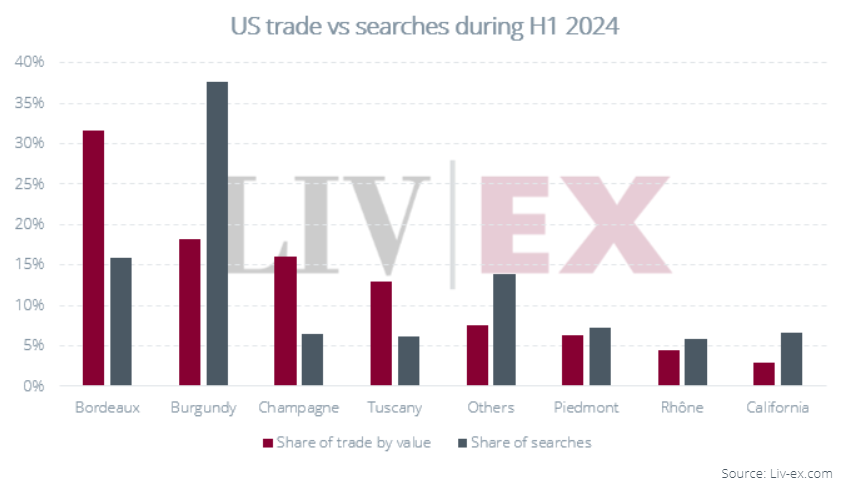
Comparing search and buying patterns offers interesting insight into a market. Over H1, Burgundy accounted for the lion’s share of searches on Liv-ex by US members (37.7%). While Burgundy is head and shoulders above the rest in terms of search patterns, its share of trade by value is significantly below that of Bordeaux (31.7% vs 18.2%).
Champagne is an interesting example, insofar as it accounted for a low proportion of searches (and only a sixth of Burgundy’s share), but climbs significantly in terms of trade share (16.1%).
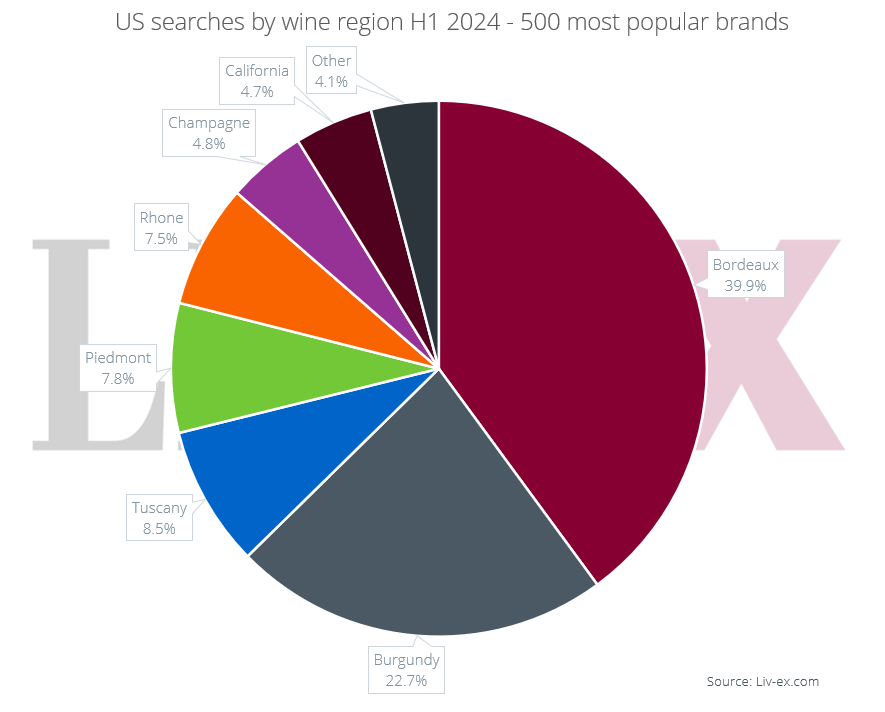
Burgundy’s search dominance can be explained by the sheer number of brands in the region. When we focus instead on the top 500 brands across all regions, Bordeaux leapfrogs into first place. This could to some extent explain Bordeaux’s significant lead in trade share, with trade tending to centre around a core of top brands.
*You can download a list of the most popular brands according to US wine businesses here.
Price, buy and sell wine smarter on the global market place for the wine trade…
REQUEST A DEMO TODAY
Drilling down into trading patterns adds more nuance. In H1 2024, US-based Liv-ex members accounted for 32.5% of all purchased value on the exchange, second only to UK-based buyers, who accounted for 34.3% of all purchases. US purchasing has been steadily rising, solidifying the country’s prominence in the secondary market.
While US purchasing volume in H1 2024 is up by 4.1% on H2 2023, purchasing value is up by only 0.8%. Overall, US merchants are buying more wine, but spending less per trade. Though, in part, this can be explained by declining prices, it is also clear that buyers are opting for lower value wines. This is not, however, the case across all wine regions. The chart below shows a rolling 6-month average of US buying by value since the start of the year, broken down by region.
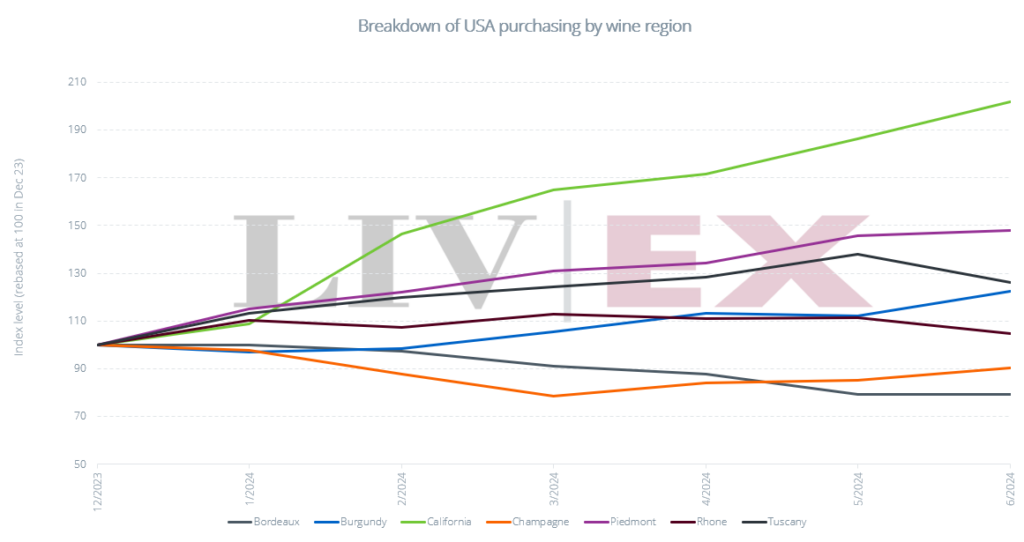
Since the start of 2023, US buyers have focused increasingly on wines from California, Piedmont, Tuscany and the Rhône. They have been turning to these regions in lieu of Bordeaux and Champagne, which have both seen decreased purchasing from US buyers.
While produced on their doorstep, US buyers have increasingly been turning to the secondary market for Californian wines. The value bought by the US in H1 2024 has more than doubled on H2 2023. Volumes, however, have increased by only 75%, pointing to greater demand for higher value wines. This growth has affirmed US buyers as prominent buyers of the region. While they accounted for only 5% of purchases of US wines in 2023, YTD this number has increased to 16.5%. Interestingly, this change in purchasing behaviour is not reflected to nearly the same degree in search patterns – from H2 2023 to H1 2024 California’s share of searches only increased from 5.8% to 6.6%
Given how tightly allocated the top Californian wines are, buyers may be attracted to the liquidity on the exchange. It may also be the case that US buyers have been capitalising on lower international pricing.
As we reported in May, the strong dollar has provided US buyers with an opportunity to buy more cheaply abroad. Taking the most popular Californian wine amongst US buyers from H1 2024, Joseph Phelps Insignia 2019, as an example, we can analyse the difference in UK and US markets. The cheapest listed price in the UK is £2,060 per 12×75, while the cheapest listed price in the US is $2,938 (considering only stocked wine prices). Using the current pound:dollar exchange rate of 0.77, this equates to £2,273. In April, at an exchange rate of 0.81, this would have been even higher – £2,380. Whether US buyers have been turning to the secondary market for liquidity, or thinking more consciously about buying abroad while the dollar is strong, there are lucrative opportunities available to them.
Price, buy and sell wine smarter on the global market place for the wine trade…