July Market Report
- While the hangover from Bordeaux En Primeur slowed trading for much June, pace started to pick up towards the back end of the month.
- Can buyers trust blue-chip Bordeaux with bottle age to hold its value better than the more abundant recent releases?
- In light of recent purchases, we look at the prime example of European and American vinous collaboration – Opus One.
- What’s going on in Châteauneuf-du-Pape? Château Rayas tops the table with a potentially perfect wine score in a recent Vinous report.
- A Technical Analyst looks at the possible next movements of the Liv-ex Fine Wine 50.
- The bid:offer ratio can be used as a measure of market sentiment. Will sustained demand for Bordeaux be enough to spark interest in the broader market? Or are we just seeing business as usual?
Introduction
A false start to summer
June proved another tough month for the fine wine market. While the hangover from Bordeaux En Primeur slowed trading for much of the month, pace started to pick up towards the back end.
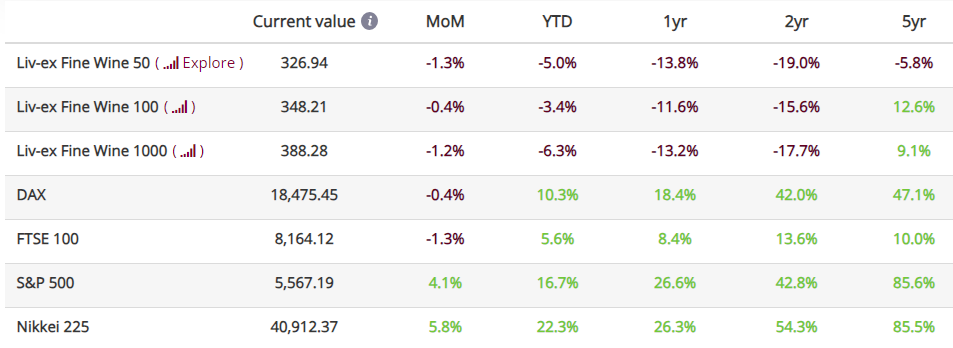
The Liv-ex Fine Wine 100 fell 0.4% in June, continuing May’s decline (0.6%).
Looking at the broader market, the Liv-Ex Fine Wine 1000 (which tracks 1,000 wines from across the world) experienced a greater decline, down 1.2% to close at 388.28, a number last seen in August 2021. Drilling down into sub-indices, the Champagne 50 and Burgundy 150 experienced the greatest declines in June (down 2.6% and 2.4% respectively). Looking for slightly more positive signs, the Bordeaux Legends 40 and the Rhone 100 recorded marginal gains of 0.3% and 0.2%.
June also saw a 1.7% decrease in the number of unique brands (LWIN7s) traded, with the number of unique wines (LWIN11s) changing hands also falling (5.4%).
Now that the dust has settled on H1 2024, we can see how market sentiment has impacted trading so far this year. The number of transactions is up compared to H1 2023 (16.8%), but average trade value is down 18.9%. In short, merchants are trading more frequently than last year but with the prices of wine down, they are spending less per trade.
Major Market Movers
Bordeaux Legends 40
It’s unlikely that an increase of 0.3% will get many people’s hearts racing, but it is worth delving deeper into the Bordeaux Legends 40, which tracks the performance of 40 Bordeaux wines from exceptional older vintages (from 1989 onwards). As we noted (repeatedly!) during Bordeaux En Primeur (see our closing report for full analysis), it was hard to make the case for buying the majority of 2023 releases, when many back vintages are better priced, physical, and in some cases, even ready to drink.
Looking over a longer period and at a more macro level, the Liv-Ex Fine Wine 50, which comprises 50 wines from more recent vintages of the Left Bank First Growths (going back to 2007 for Latour and 2012 for the remaining chateaux), has struggled compared to the Bordeaux Legends 40. So too the Right Bank 50, which is comprised of more recent vintages of Ausone, Cheval Blanc, Lafleur, Le Pin, and Petrus has not kept pace.
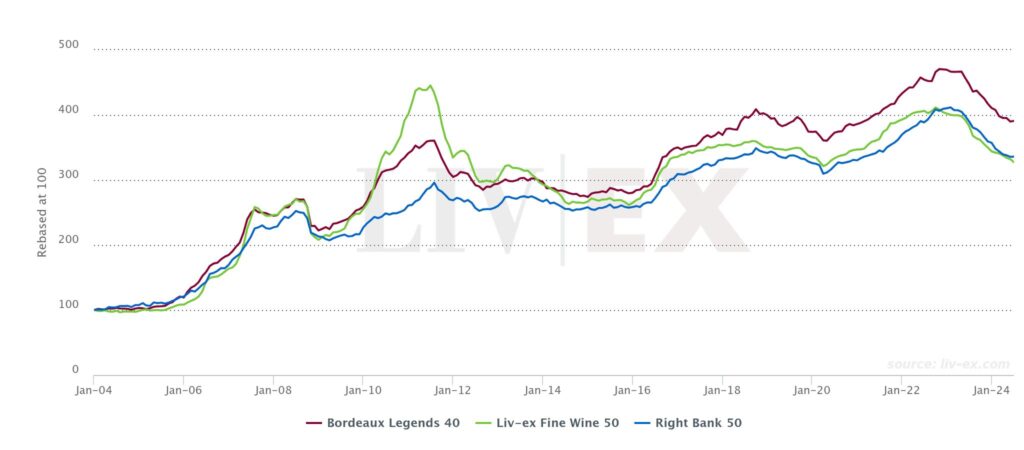
*made using the Liv-ex Charting Tool.
Since the start of 2017, there has been a clear divergence of the Legends 40 from the Fine Wine 50, the former gaining 11.6% while the latter decreased 2.5%. It appears that over the longer-term, blue-chip Bordeaux with bottle age can be trusted to hold its value better than the more abundant recent releases.
Over the shorter-term, however, due to their relative illiquidity, the Bordeaux Legends 40 can display more volatility, as seen with Petrus 2000 in June.
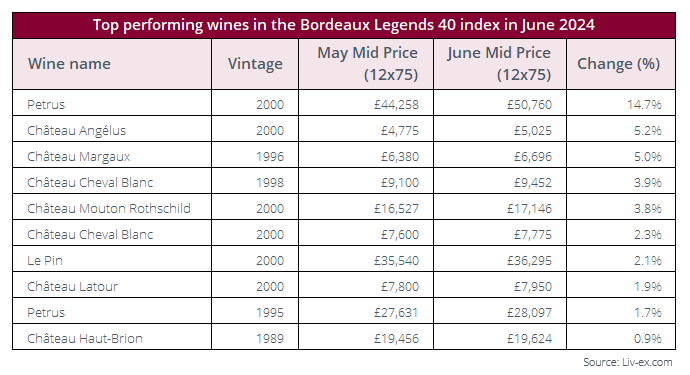
Rising 14.7% over the month, Petrus 2000 drove much of the wider Bordeaux Legends 40’s performance. It was joined by five other wines from the 2000 vintage which recorded increases during June – Château Angelus (+5.2%), Château Mouton Rothschild (+3.8%), Château Cheval Blanc (+2.3%), Le Pin (+2.1%) and Château Latour (+1.9%).
News Insight
International vinous collaboration
June saw some major European producers complete purchases of US estates. Faiveley has become the majority stakeholder of Sonoma’s Williams Selyem, Antinori has taken full ownership of Washington State’s Col Solare, and the Bouygues Group (owners of Montrose and Clos Rougeard among others) has bought Virginia’s RdV Vineyards.
In this context, we look at the recent price performance of Opus One – the prime example of European and American vinous collaboration.
Founded in 1978 – one year earlier than Williams Selyem – as a collaboration between Baron Philippe de Rothschild and Robert Mondavi, Opus One marked the first foray of a Bordeaux producer into the New World. It has since become one of the most sought-after Napa Valley wines, the second most-traded US wine on Liv-ex by value (behind Screaming Eagle), and the most-traded by volume.
Opus One has certainly benefitted from the head start that comes with the Rothschild brand and distribution network. It has also tended to take a methodical and long-term approach to building on that strong foundation. This approach has proven successful, as shown by its relatively consistent price performance over the past 20 years and current trading volumes.
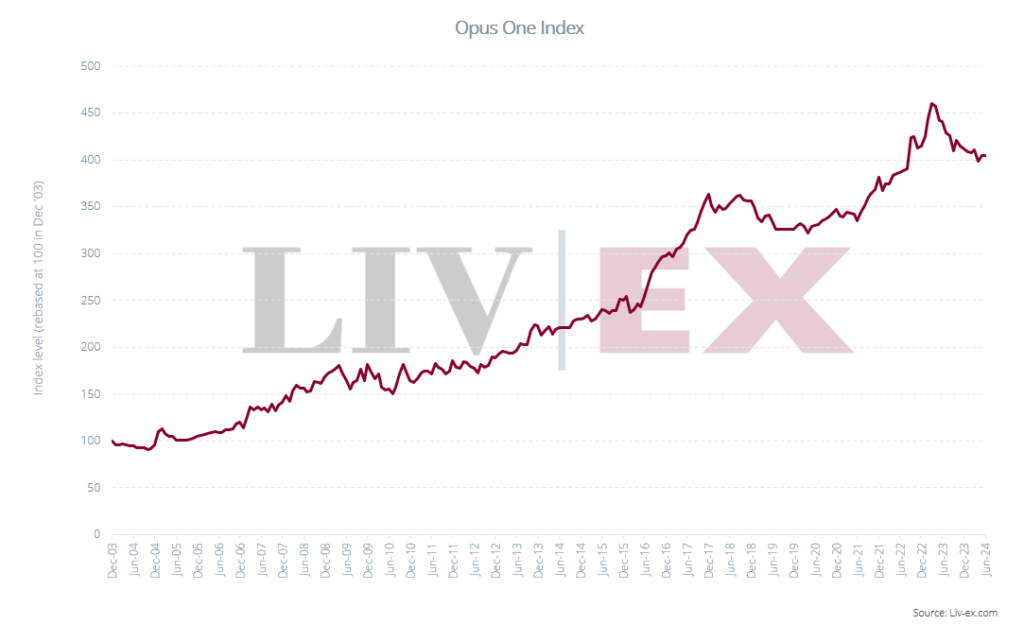
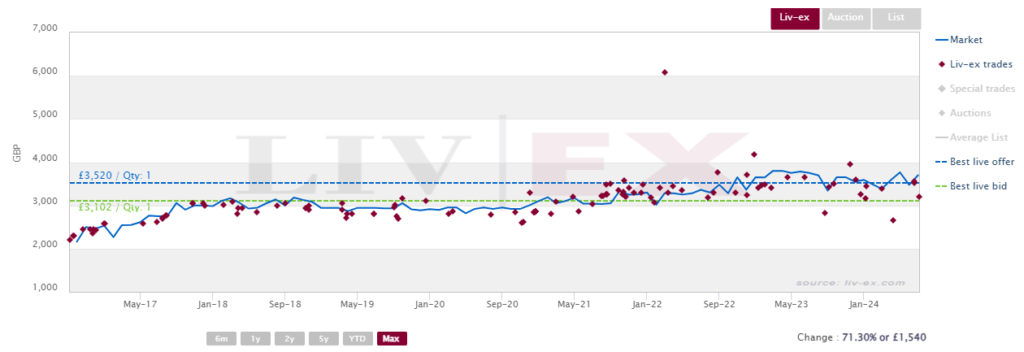
Looking at recent vintages, Opus One 2013, rated 97+ by Robert Parker, and 96 by Antonio Galloni as recently as May 2024, has risen 71.3% since it first started trading on the secondary market, buoyed by a consistent level of trading.
Opus One 2013 trades on Liv-ex
However, it is unlikely that the estate purchases in Washington State and Virgina will find such favour on the secondary market anytime soon. As would be expected, secondary trade of US wines is overwhelmingly dominated by California (97.0% year to date), and in particular by Napa Valley and its various subregions (71.5%).
Critical Corner
What’s going on in Châteauneuf-du-Pape?
In his article Châteauneuf-du-Pape 2022: Bring It On for Vinous, Nicolas Greinacher hails the 2022 as ‘a very good vintage here’, noting that earlier harvests than 2021 and 2020 resulted in many wines having a ‘red-fruit-driven, ripe and juicy profile instead of displaying overripe or jammy characteristics’.
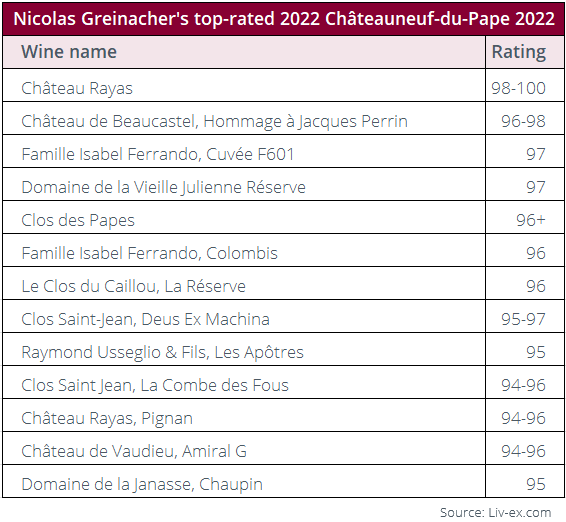
Greinacher focuses on two specific aspects of Châteauneuf-du-Pape in his article: ‘the management of old vines and the essentials of running a successful family winery. Mastering these two aspects is vital, especially in the context of Châteauneuf-du-Pape, where failure to do so can spell doom for business’.
Rayas, the region’s great outlier, tops the table with a potentially perfect wine. In a previous update we noted that, thanks to Rayas’ reportedly consistent ex-domaine release prices, price fluctuations are almost entirely driven by the secondary market. And while its quality remains a given, Rayas’ price correction over recent years has been significant (down 39% over the past 18 months).
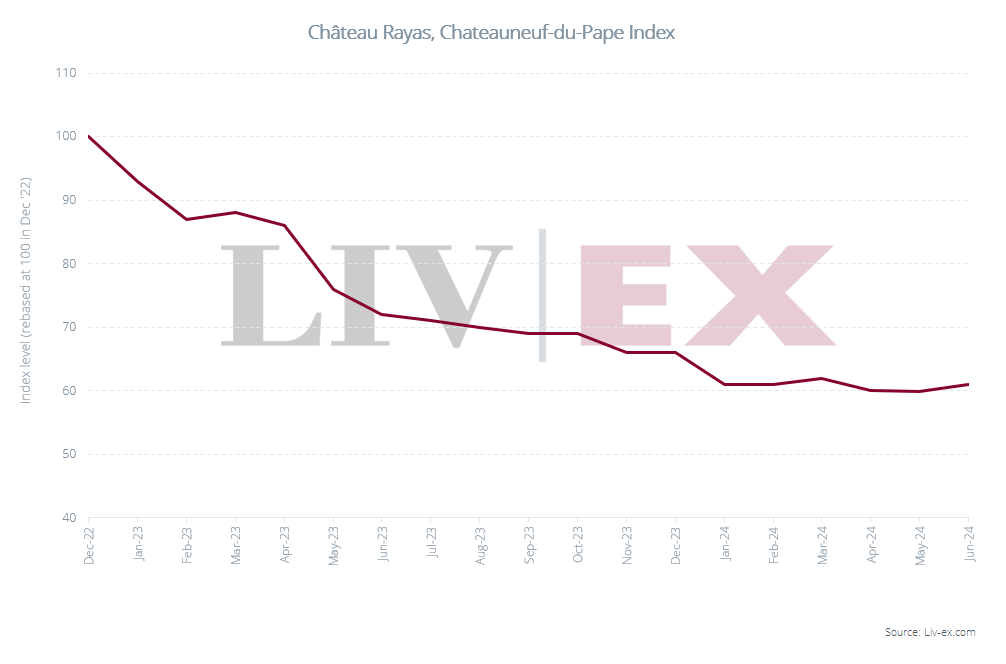
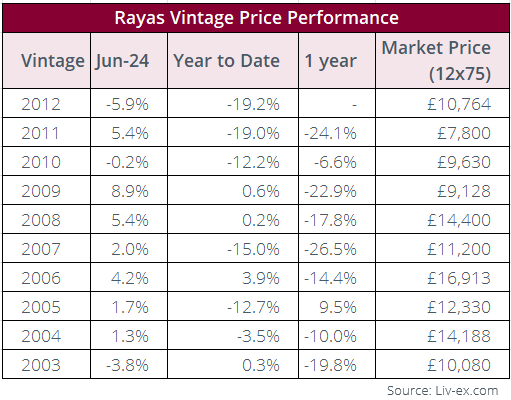
It is unlikely that the 2022 Rayas will be released any time soon – the domaine only releasing once a vintage is deemed mature – but the 2012 paints an interesting picture. Rated 98 by Greinacher and just entering its drinking window, its price decreased 5.9% during June and is down 19.2% year to date.
There are, however, some signs that certain back vintages might be bottoming out, with each vintage between 2004 and 2009 recording an increase during June (of between 1.3% and 8.9%).
Broadening the picture to the Rhône 100, the index’s 0.2% rise during June was driven by Châteauneuf-du-Pape, with 17 of the 28 wines that recorded a price increase during the month hailing from the region. As the chart below shows, the Northern Rhône index decreased slightly during June.
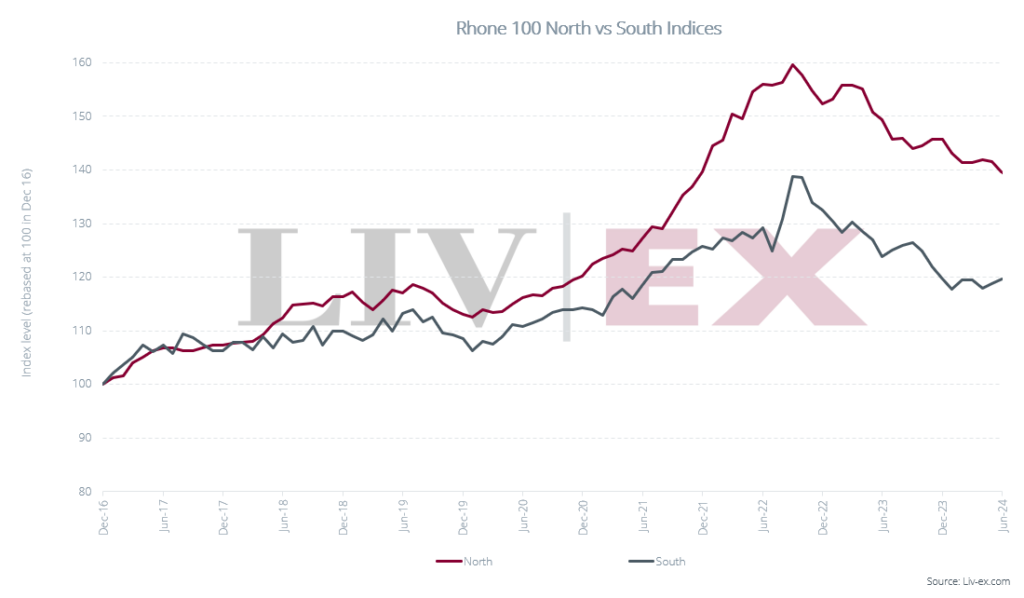
Chart of the Month
Technical Analysis of the Liv-ex Fine Wine 50
In December 2023, we conducted a technical analysis of the Liv-ex Fine Wine 50. At that time, the index had begun to fall, and sat at 350. We wrote that the break of the primary trendline, initiated in 2005, was a threat to the long-term bullish trend and that the index may find support at the Fibonacci retracement level of 321. Having now reached 327, the index is fast-approaching this support.
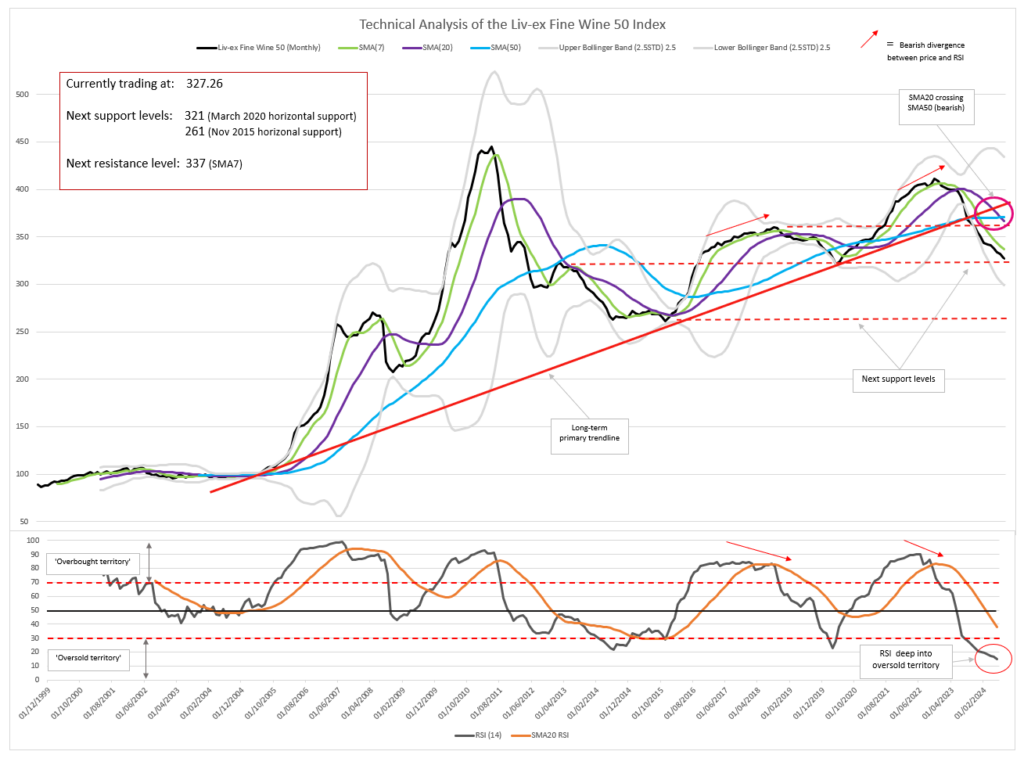
Since September 2022, the index has fallen by more than 20% – a threshold at which we consider a downturn a bearish trend rather than a correction. The Simple Moving Average 7 months (SMA7), used to assess the short-term trend, continues to closely trail the price. The SMA20 is also moving down, indicating a bearish trend in the medium-run. The SMA50, however, remains flat, leaving the slightly bullish long-term trend intact.
The SMA20 is about to cross the SMA50 from above. As demonstrated by price movements in May 2013, this pattern is usually an indication of downward momentum in the market. In more recent years, however, the SMA50 has flattened, rendering this effect less pronounced – the downward cross in December 2019 was followed by upward price movements.
Possible next movements
It is possible that the price will find support on the horizontal support at 321 and bounce from here to form another ‘intermediary top’ before dropping again below 321. Such price action would validate a head and shoulders pattern. On the other hand, should the price break below the 321 horizontal support, we see very little support before the next horizontal level at 261 (the November 2015 lows).
To assess the likelihood of the index bouncing back up, we can draw inference from the Relative Strength Index (RSI) and Bollinger Bands. In August 2023, the RSI fell below 30 and has sunken to depths never reached in the index’s history. In theory, this should generate a buy signal, as was the case in late 2015 and early 2020. In both cases, however, the drop was coupled with low volatility, indicated by a squeezing of the Bollinger Bands. With volatility currently high and showing no sign of decreasing, we cannot find sufficient evidence of an imminent trend reversal.
We will monitor how the RSI develops and whether a bullish divergence with the price may appear, but, at the time of writing, it appears likely that we have further still to fall.
Final Thought
Sentimental value
The bid to offer ratio, which compares the total number of bids to the total number of offers on the Liv-ex exchange, is one measure of market sentiment. When market participants believe prices will rise, they are incentivised to place bids. Given that market participants collectively determine price movements, widespread changes in confidence generally predate trends.
As shown in the chart below, the bid:offer ratio falling below 0.5 has, historically, been predictive of a market downturn. Conversely, a sustained ratio above 0.5 has been followed by an upward trend.
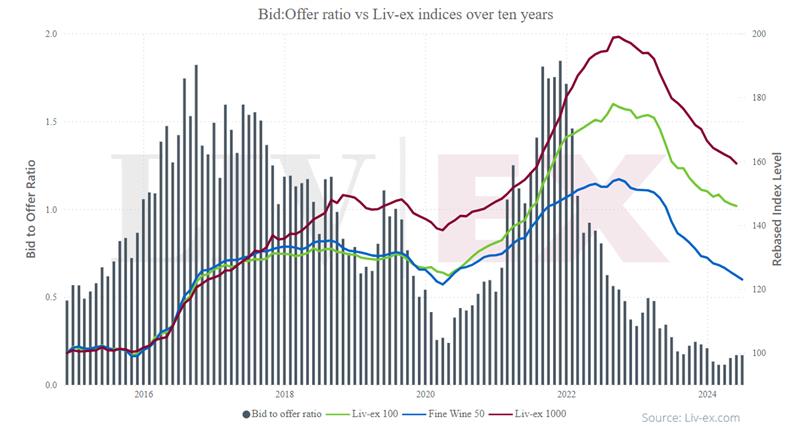
In early 2022, the bid:offer ratio fell sharply, predating the turn of the market by more than six months. When participants lost faith in the market, they attempted to sell at what they believed to be the peak. Prices held for some time, until finally forced down. Once prices have found their floor – or market participants believe they have – we can expect increased demand.
Currently sitting at 0.17, the bid:offer ratio on the exchange has reached new lows. However, the ratio’s upward trajectory over the last couple of months may be an early indication of a slightly increasing demand in the secondary market. The question remains, then, for which wines is demand increasing?
The devil you know – Bordeaux
The chart below shows bid exposure – the total value of firm bids – over the last five years for Burgundy, Bordeaux and Champagne. It appears that the recent uptick in the bid:offer ratio can be largely attributed to increased demand for Bordeaux wines.
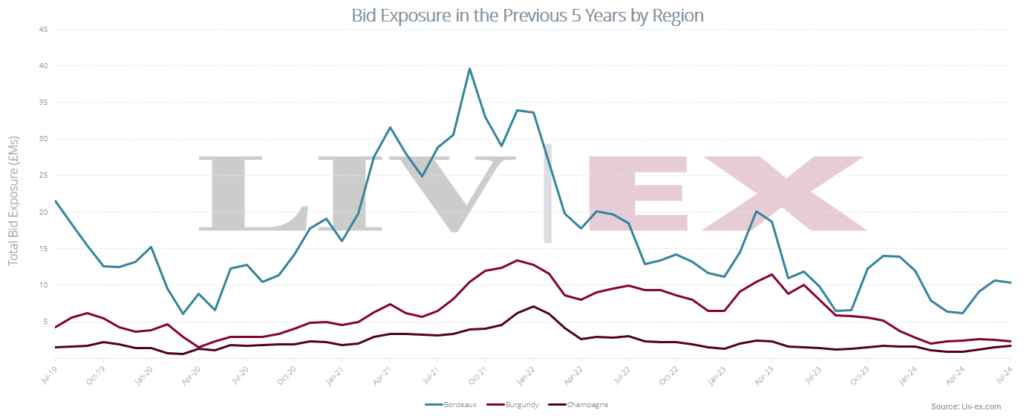
During times of sustained upward movement, as seen from April 2020 to January 2023, Burgundy and Champagne enjoy increased demand – though this demand came in later and more moderately than in Bordeaux. Over the past year, bid exposure for Burgundy has fallen steadily and, for Champagne, has remained flat.
By contrast, demand for Bordeaux, overall higher than for any other region, has fluctuated. Even in a market as uncertain as today’s, there remains liquidity in the region, making it a safer bet for investors.
Another way to look at sentiment is to consider the risers to fallers ratio. Since we expect demand to drive prices up, we may expect the risers:fallers ratio and bid:offer ratio to positively correlate with the Liv-ex indices.
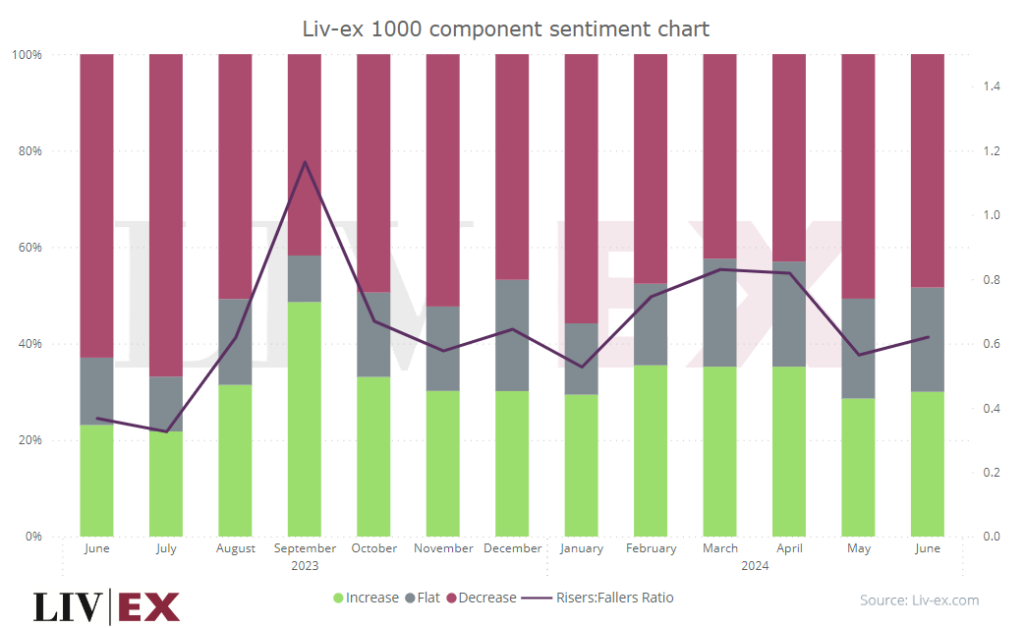
While we can observe certain spikes in the risers:fallers ratio in the past two years, the Liv-ex 1000 has maintained a steady downward trend. In September 2023, for example, the risers:fallers ratio rose sharply while the index continued to fall.
Though over 30% of the Liv-ex 1000 components increased in price this month, those that fell did so to a greater magnitude. The wines that fell did so by an average of 2.85% while the risers increased in value by an average of 0.03%.
Slicing the data by price, we observe that less expensive wines are holding their value better on the secondary market. Month on month, overall traded volume is down by 2.8%, while traded value is down by 4.2%. We find that prices of the 500 most expensive have fallen, on average, by 0.84%. By contrast, prices of the 500 least expensive have fallen by only 0.12%.
With the market down, it appears that buyers are playing it safe – turning to liquid, stable regions, and opting for lower priced wines. Will sustained demand for Bordeaux be enough to spark interest int he broader market? Or are we just seeing business as usual?