- The Italy 100 has outperformed the Liv-ex Fine Wine 1000 over the last two years.
- Since its peak, its Piedmont components have fared far better than the Super Tuscans.
- What can we learn from their recent price performance?
- Will the bulls return following the current price consolidation?
In the April 2024 Market Report, our Technician analysed the Super Tuscan components of the Italy 100. Compared with their counterparts in Piedmont, their prices have fallen further since the Italy 100 peaked in November 2022. A smooth-shaped SMA7 line and widening Bolinger Bands prompted our Technician to conclude that the current bearish momentum might be expected to accelerate.
What about the Piedmontese wines in the index? Collectively, they’ve fallen just 2.1% in price compared to a 7.2% fall in the value of the index itself since its peak. What would a technical analyst expect to happen to Piedmont prices?
Until October 2022, the basket of Piedmont wines shows a bullish trend before entering a period of consolidation with the level fluctuating between 118 and 124. The dotted line illustrates the pattern being a descending triangle, or slightly outside a symmetrical triangle; tending to represent a pattern of continued consolidation. We should monitor whether the price bounces if it hits the horizontal support level around 118 (the previous low of 2022).
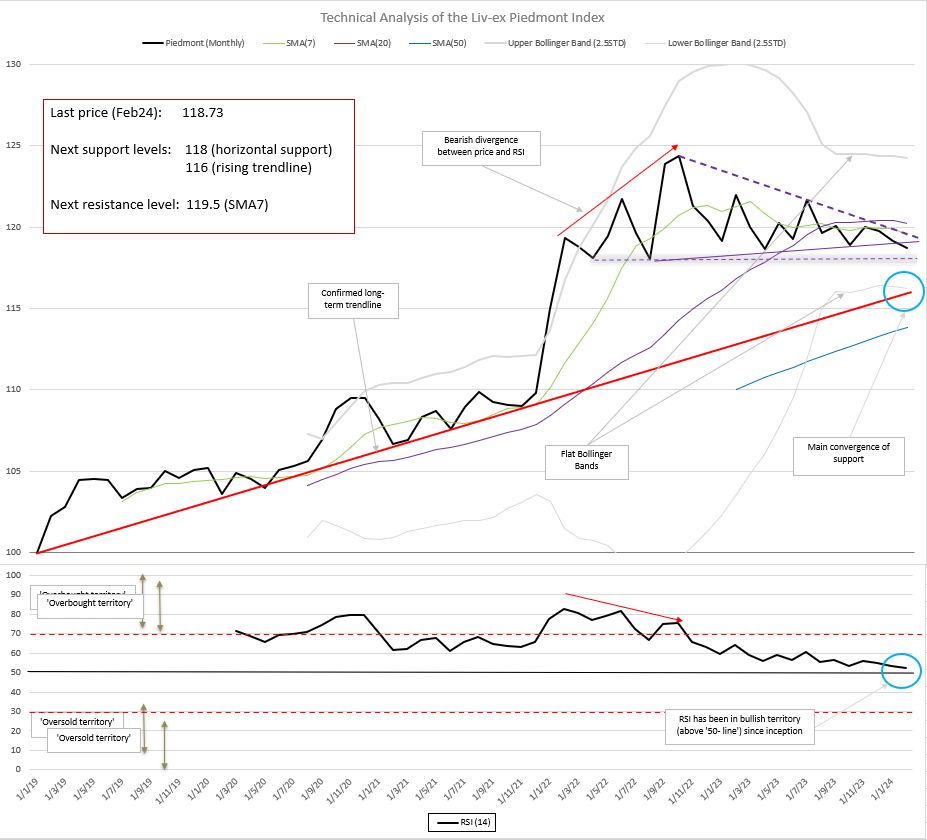
In addition to the evident triangle patterns, we note that the Simple Moving Average 7 Months (SMA7) and 20 Months (SMA20) are relatively flat and capping the price. Similarly, the Bollinger Bands (BB) have squeezed since October 2023 and are also flat, reflecting uncertainty as to which direction the next price move could be.
The momentum as expressed by the Relative Strength Index (RSI) has declined in the last 2 years but remains above the ’50 line’ or ‘bullish territory’. The loss in momentum is in line with a market correction within a larger bullish trend. We will monitor the reaction of the RSI against the ’50 line’ in the next few months.
This expectation of continued price consolidation suggests to a technician that there is little to do but wait.
Bulls would look for the level to bounce either on 118 or on the main convergence zone (the lower Bollinger Band and the rising long-term trendline) at 116. Should the price break below this area and test the SMA50 and break it, the long-term bullish trend would then become vulnerable. We’d then look towards the next support level around 110.
As a Liv-ex member on Gold or Black package, you can use the Technical Analysis Tool to forecast future price changes and increase the probability of making more profitable trading decisions. You’ll find an explanation of the techniques and further resources and training links in this post; How to predict fine wine prices.